Gene-Body Methylation in Three Reef Corals Marks Stable Expression but Does Not Track Seasonal Change
A short non-peer-reviewed scientific report
This report is a Roberts Lab working manuscript. It has not been peer reviewed.
It is shared to make small scientific efforts, preliminary analyses, technical observations, and exploratory work openly available.
1 Abstract
Is gene-body methylation (GBM) in corals a stable mark of constitutively expressed genes, or a regulator that shifts expression with season? Six pre-registered hypotheses (H04, H05, H06, H15, H16, H18) were tested in the E5 MOSAiC time series: about 10 colonies each of Acropora pulchra, Porites evermanni and Pocillopora tuahiniensis, sampled in January, March, September and November 2020 in Mo’orea, with CpG methylation and RNA-seq from the same samples. One hypothesis was supported (H05): genes with more GBM are more highly expressed (Spearman rho 0.21 to 0.37) and vary less across the year. The other five were inconclusive (H04, H06, H15) or not supported (H16, H18), but they point the same way. Methylation carries colony identity and little season. Seasonal GBM change is not reproducible across colonies and is not coupled to expression change within colonies (the test was powered for a per-colony correlation of about 0.03; all observed values were below 0.02). Neither layer leads the other, and GBM explains about 0.03–0.13% of within-colony expression variance. A seventh, follow-up test (H23) asked whether the much larger seasonal plasticity of A. pulchra sits in its low-GBM genes. It was inconclusive, but bounded: the A. pulchra excess differs between the 25th and 75th GBM percentiles by at most about 0.02 vst units, against an excess of 0.11. An eighth (H24) found that orthologs occupy similar GBM ranks in all three species, well beyond a null matched for expression, gene length and CpG count (Spearman rho 0.29–0.48 against null means of 0.06–0.09). One pair fell just below the pre-registered 0.30 minimum, so H24 is also inconclusive. On these observational data from about 10 colonies per species, GBM behaves as a stable marker of expression level and steadiness, not as a seasonal regulator.
2 Background
In many invertebrates, methylation is concentrated in the bodies of broadly expressed, housekeeping-like genes. Whether it does more than mark them is debated. If GBM were a seasonal regulator in corals, methylation should shift reproducibly between seasons, its change should track expression change in the same colony, and change in one layer should predict later change in the other. The E5 MOSAiC design, with the same colonies sampled four times in one year, allows each to be tested. The six hypotheses were committed separately, each with its own decision rule, before analysis. Because they answer one question, they are reported together, each verdict given as pre-registered before interpretation. H23 and H24 were added afterwards. They were proposed and pre-registered on 2026-10-08 because H05 and H02 (A. pulchra has about ten times more seasonally changing genes than the other species) were supported. They reuse the same data, so they are follow-ups, not replications.
3 Methods
Data. CpG methylation (sites with ≥ 10x coverage in all samples), gene counts and gene coordinates from the E5 MOSAiC data portal, pinned at commit 86432e3. Samples with both layers: A. pulchra 39, P. evermanni 37, P. tuahiniensis 32, from 10 colonies per species. GBM is the mean percent methylation over a gene body with ≥ 5 covered CpGs. Expression is DESeq2 vst. Genes with both GBM and expression: 1,641, 1,796 and 16,600. The ten-fold difference follows from upstream CpG matrices that differ about 20-fold in size (96,772, 242,100 and 1,991,606 sites; decision D-008).
Tests. Every model treats colony as a random effect or blocking factor, and timepoint as a repeated measure.
- H04: PERMANOVA (
~ colony + timepoint) and variance partitioning on both layers. - H05: per gene, Spearman rho(mean GBM, mean expression) and the GBM coefficient in
lm(cv ~ ns(mean_expr, 3) + gbm), CV across timepoints. - H06: per colony, Spearman rho across genes between TP1→TP3 change in GBM and in expression; T is the mean over colonies. The null pairs each colony’s methylation change with another colony’s expression change, removing the shared seasonal shift. Power simulated at the observed n.
- H15: persistence at TP4 of the TP1→TP3 shift, methylation against expression, with leave-one-colony-out gene selection.
- H16: cross-lagged panel model on gene×colony-centered data, with a colony-permutation null and a no-lag simulation of noise asymmetry.
- H18: commonality analysis of within-colony expression variance with GBM and the nearest cis-lncRNA as predictors, plus a mediation path.
- H23: per three-way ortholog, seasonal amplitude (SD of the four colony-adjusted timepoint means) and within-species GBM percentile, on 706, 638 and 9,311 orthologs with ≥ 5 CpGs. One mixed model across species (
amplitude ~ species * (gbm_pct + covariates) + (1 | ortholog)); the contrast is the A. pulchra excess over the other two species at the 25th minus the 75th GBM percentile, with 1000 colony-bootstrap resamples. A gate requires the gene set to show the A. pulchra excess first. - H24: per species pair, Spearman rho between the two species’ per-gene GBM over orthologs eligible in both (91, 678 and 610). The null shuffles ortholog pairings 2,000 times within strata of expression, gene length and CpG count (the finest of a fixed hierarchy with ≥ 10 orthologs per stratum), Holm across pairs; 1000 colony-bootstrap resamples. Supported only if all three pairs have rho > 0.30, CI > 0 and adjusted p < 0.05.
H06 and H18 each carry one dated amendment, written before analysis, that fixes the nulls; the decision-rule text was not changed.
4 Results
| Hypothesis | Question | Pre-registered verdict | Key numbers (Apul / Peve / Ptuh) |
|---|---|---|---|
| H05 | Is GBM associated with higher, steadier expression? | supported | rho(GBM, expression) 0.30 / 0.21 / 0.37; GBM coefficient on CV −0.08 / −0.12 / −0.13 (all CIs < 0) |
| H04 | Is methylation more colony-specific than expression? | inconclusive | colony R² methylation 0.69 / 0.62 / 0.66 vs expression 0.37 / 0.52 / 0.45; median colony fraction methylation 0.155 / 0.059 / 0.000 vs 0.079 / 0.136 / 0.089 |
| H06 | Does seasonal GBM change track expression change within colonies? | inconclusive | T −0.014 / 0.006 / 0.018 (p 0.95 / 0.42 / 0.088); power ≥ 0.8 for T ≈ 0.03 |
| H15 | Does a seasonal GBM shift persist after expression reverts? | inconclusive | GBM shift (b31) −0.26 / −0.10 / 0.13, all CIs include 0; Apul expression shift 0.81, persistence 0.18 |
| H16 | Does expression change precede methylation change? | not supported | beta_EM − beta_ME 0.058 / 0.002 / −0.051; no coefficient differs from null |
| H18 | Do GBM and cis-lncRNA explain independent parts of expression change? | not supported (hierarchical in Apul, Peve) | unique GBM R² 0.0013 / 0.0003 / 0.0004; unique lncRNA 0.021 / 0.068 / 0.029; shared ≈ 0 |
| H23 | Is A. pulchra’s excess seasonal plasticity concentrated in low-GBM genes? | inconclusive | Apul excess 0.110 (CI 0.019–0.152) vst units; contrast 25th − 75th percentile −0.003 (CI −0.024 to 0.020) |
| H24 | Do orthologs keep similar GBM ranks across species? | inconclusive | rho Apul–Peve 0.286, Apul–Ptuh 0.479, Peve–Ptuh 0.369 (null means 0.06–0.09; Holm p ≤ 0.019) |
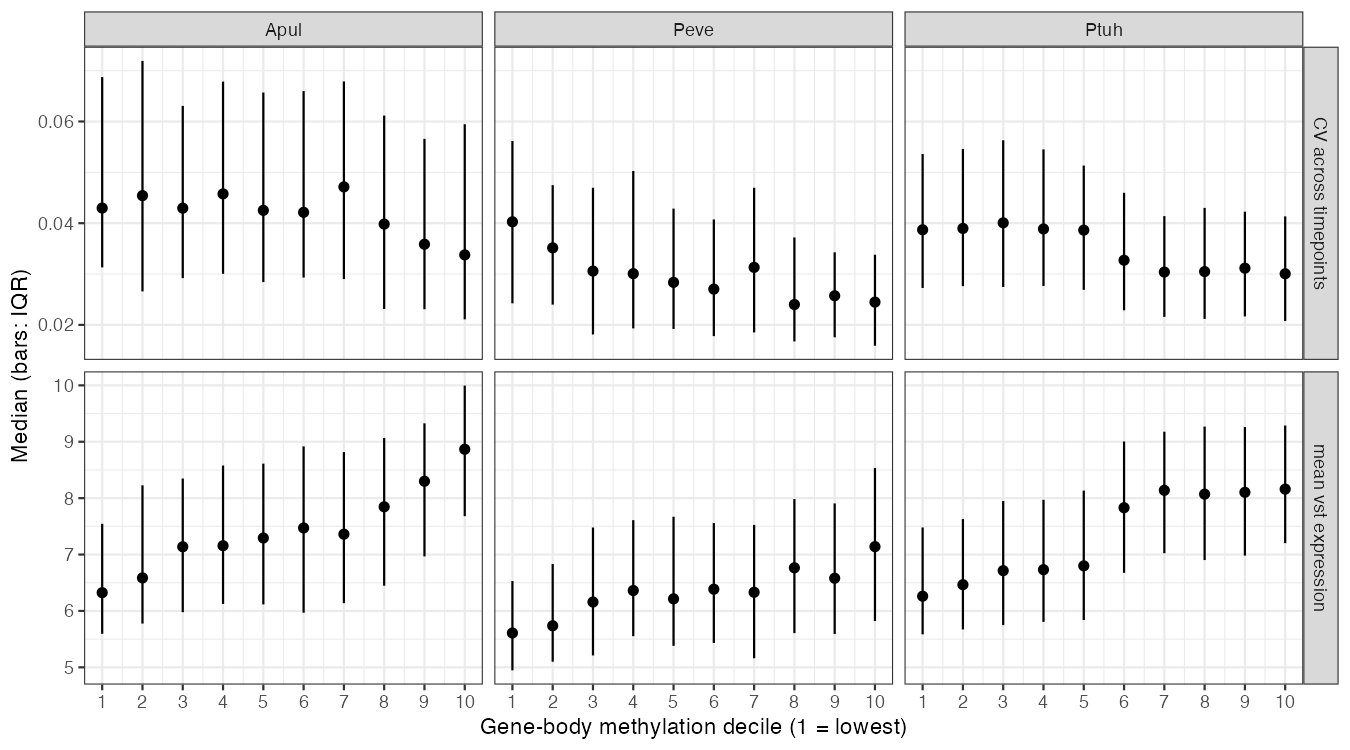
GBM marks higher, steadier expression (H05, supported). In all three species, mean GBM correlates positively with mean expression and negatively with expression CV once expression level is controlled (Table 1, Figure 1), also with ≥ 2 CpGs per gene. P. evermanni clears rho > 0.2 on its point estimate only (0.212, CI 0.164–0.259), and the CV effect is modest (one SD more GBM, 0.08 to 0.13 SD less CV). In P. tuahiniensis expression steps up between GBM deciles 5 and 6, consistent with separate unmethylated and methylated gene classes.
Methylation carries colony, not season (H04, inconclusive). PERMANOVA colony R² is higher for methylation in all three species, but the variance-partition half of the rule favors methylation only in A. pulchra, so the verdict is inconclusive. Most CpGs are near 0% methylation, where variance is read-sampling noise. Among the most methylated tercile, colony identity is stronger in methylation than in expression in A. pulchra and P. evermanni (colony fraction 0.547 vs 0.079 and 0.420 vs 0.136); P. tuahiniensis cannot answer this. In every species, timepoint explains less of the methylome (R² 0.04–0.05) than of the transcriptome (0.09–0.25).
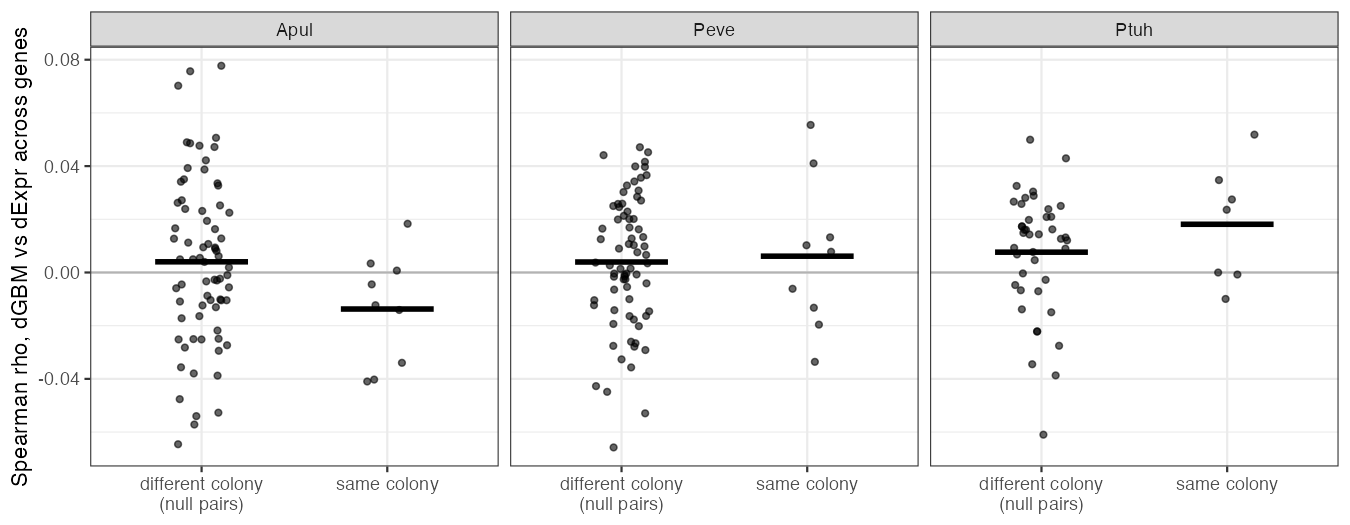
No within-colony coupling of seasonal change (H06, inconclusive). No species had T > 0 with p < 0.05, ruling out supported; T was positive in two species, ruling out not supported (Figure 2). The power simulation makes the result informative: at the observed n, power was 0.92, 0.99 and 1.00 for simulated per-colony coupling of T = 0.034, 0.037 and 0.042. All observed T values were below 0.02. P. tuahiniensis is the only hint (DM genes p = 0.030). The 2 kb upstream windows gave the same result.
No reproducible seasonal GBM shift (H15, inconclusive). The January-to-September GBM shift (b31, how closely each colony follows the others) has an interval including 0 in all three species, so there is no shift whose persistence can be measured; the rule calls this inconclusive. The persistence differences are ratios of noise, with intervals spanning tens of units. By contrast, the A. pulchra expression shift is reproducible (b31 0.81, CI 0.29–0.85) and had mostly reverted by November (persistence 0.18, CI −0.44 to 0.56), as temperature did.
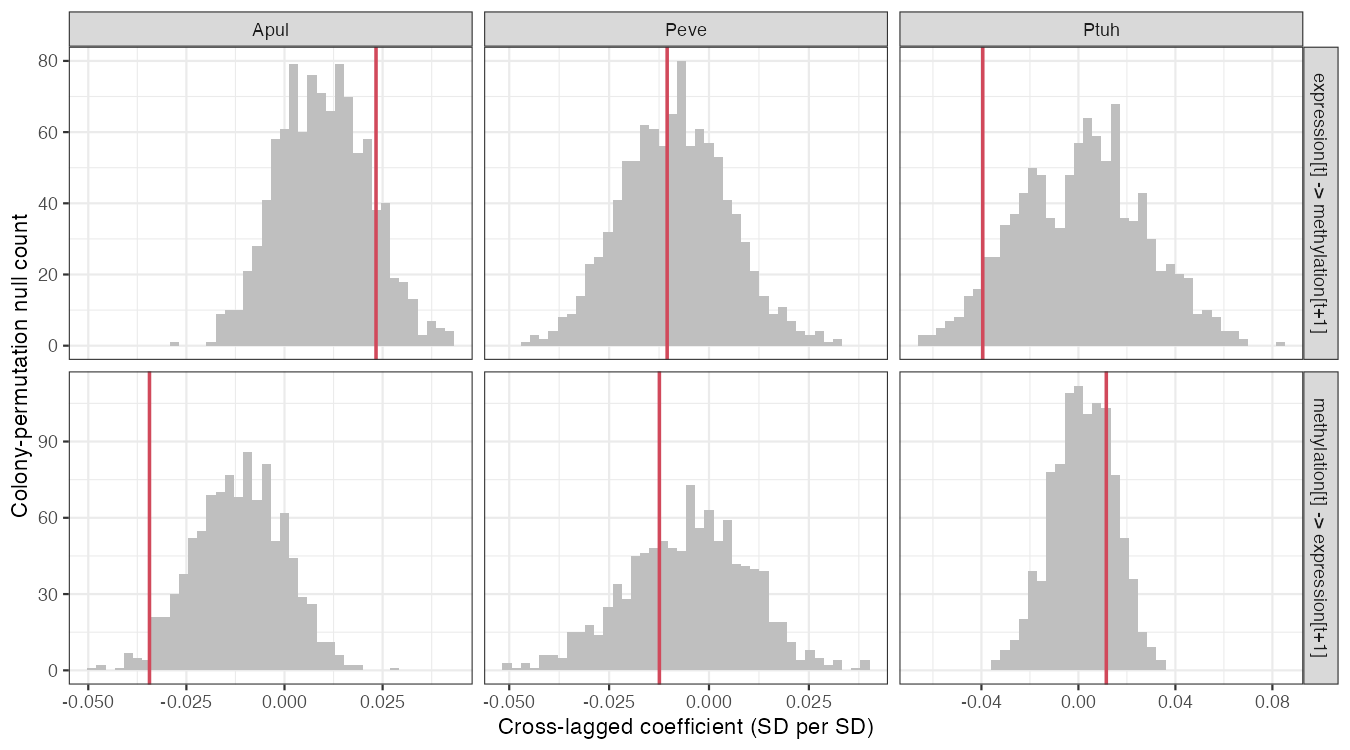
Neither layer leads (H16, not supported). No cross-lagged coefficient (all within ±0.04 SD per SD) differs from its colony-permutation null in any species, a not supported condition (Figure 3). The A. pulchra difference favoring expression-leads (0.058, CI 0.019–0.101) lies inside the range that unequal measurement noise produces with no true lag (−0.049 to 0.064). In P. tuahiniensis the methylation-leads clause was met only in the three-way ortholog check (CI −0.087 to −0.002).
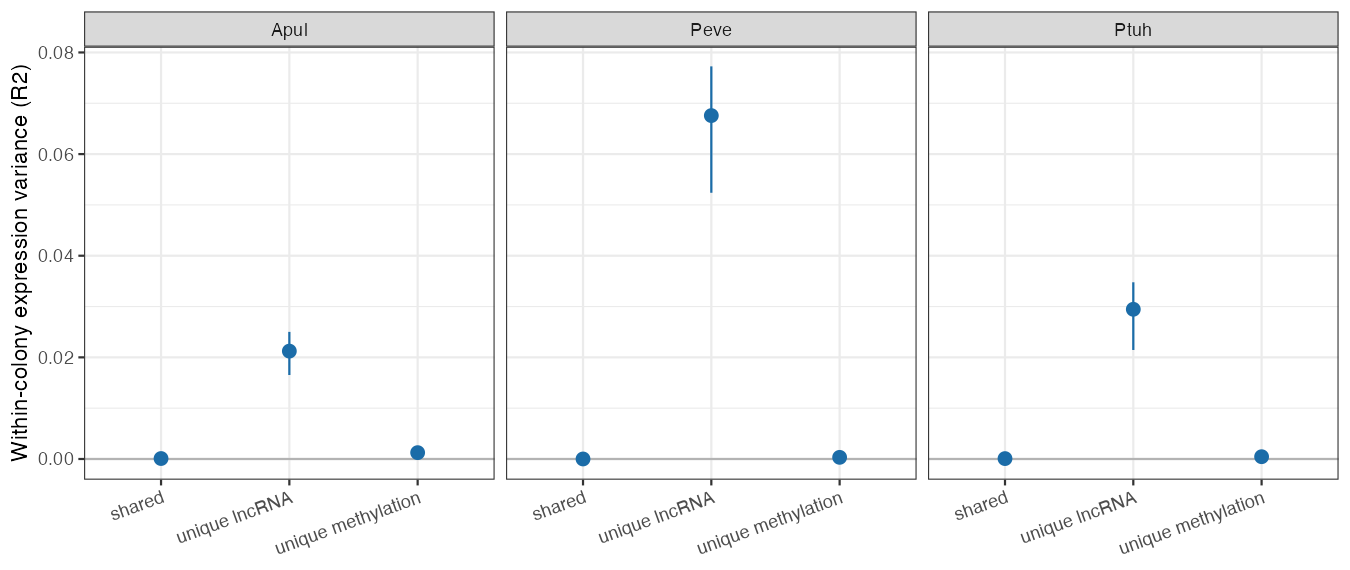
GBM explains almost none of within-colony expression variance (H18, not supported). By the ordered classification in the amendment, A. pulchra and P. evermanni were hierarchical (lncRNA-locus methylation → lncRNA → gene) and P. tuahiniensis independent, so the verdict is not supported. The hierarchical calls are fragile: they rest on 101 and 63 lncRNA loci with measurable methylation, the methylation → lncRNA path is about r = 0.04, and the A. pulchra call does not survive the ≥ 20 CpG check. The robust numbers are in Figure 4. Unique GBM explains 0.03–0.13% of within-colony expression variance, above its null only in P. tuahiniensis (p = 0.021). The nearest cis-lncRNA explains 2–7%, and the shared fraction is about 0 in every species and check.
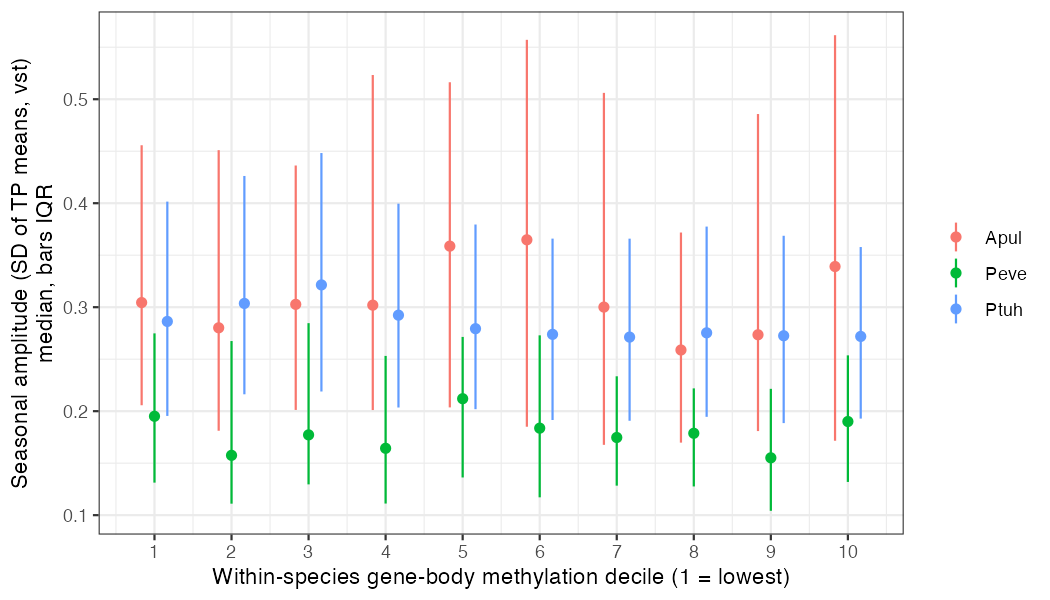
The A. pulchra plasticity excess is spread across GBM (H23, inconclusive). The orthologs analysed carry the A. pulchra excess (seasonal amplitude 0.110 vst units above the other two species, CI 0.019–0.152), so the gate passes. The difference in that excess between the 25th and 75th GBM percentiles is −0.003 (CI −0.024 to 0.020), so the rule returns inconclusive. The interval is narrow: any concentration of the excess at low GBM is at most about a fifth of the excess itself (Figure 5). The six sensitivity checks disagree in sign. Well-annotated orthologs give a positive contrast (0.034, CI 0.007–0.056). The 88 orthologs with ≥ 5 CpGs in all three species (−0.068, CI −0.113 to −0.012) and the model without expression-level adjustment (−0.030, CI −0.050 to −0.012) give a negative one. The result is robust in being small, not in its direction.
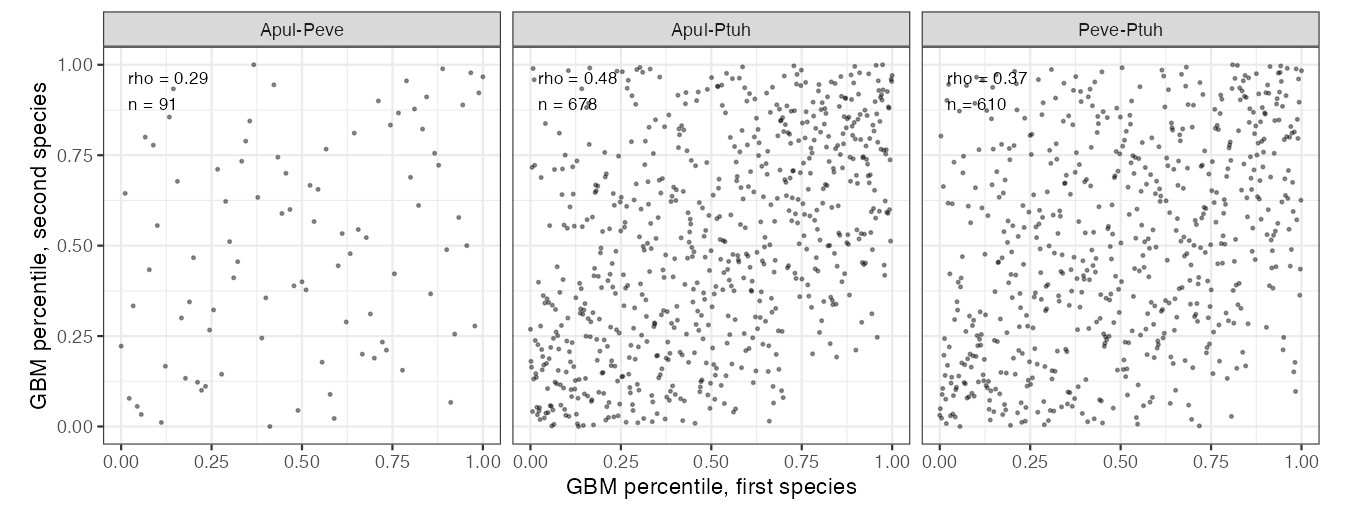
Orthologs share GBM rank across species (H24, inconclusive). In every species pair, orthologs have similar GBM ranks (Figure 6), far above a null that pairs genes matched for expression, gene length and CpG count (null means 0.06–0.09; excess over null 0.22–0.39). The two pairs with P. tuahiniensis meet every condition (rho 0.479 and 0.369, Holm p = 0.0015). A. pulchra–P. evermanni, with only 91 shared eligible orthologs, exceeds its null (Holm p = 0.019) but its rho of 0.286 is below the pre-registered 0.30 minimum, so the verdict is inconclusive. Checks on the 88 genes eligible in all three species (0.27 / 0.40 / 0.33) and on genes with ≥ 20 CpGs (0.35 / 0.38, Ptuh pairs only) agree. The exception is 30 well-annotated A. pulchra–P. evermanni orthologs (−0.115).
5 Discussion
Under their pre-registered rules, these eight tests give one supported, five inconclusive and two not supported verdicts. Read together, they describe one pattern. GBM is associated with which genes are highly and steadily expressed (H05) and with which colony a sample came from (H04, methylated CpGs). It does not move reproducibly with season (H04 secondary, H15). Where it moves, the change is not coupled to expression change in the same colony (H06), does not predict later expression or follow earlier expression (H16), and explains almost no within-colony expression variance (H18). In the primary H23 analysis, A. pulchra’s larger seasonal swings occur across the GBM range rather than mainly in weakly methylated genes, though the checks disagree in direction (H23). Which genes carry GBM is itself partly shared across the three genera: orthologs hold similar GBM ranks well beyond what expression, length and CpG content explain (H24), consistent with GBM as a long-standing property of the gene. Expression, by contrast, shifts with season, strongly in A. pulchra, where the shift largely reverts as temperature does (H15). On this timescale, GBM behaves as a stable property of the gene and the colony, not as a seasonal regulator of transcription.
This fits the view that invertebrate GBM follows long-term transcriptional status rather than setting it, but the data do not test that mechanism; they show only that no seasonal regulatory signal is detectable, and bound per-colony coupling below a correlation of about 0.03. P. tuahiniensis shows faint signals in several tests (H06 DM genes, H15 lower bound near 0, H18 unique GBM above null, one H16 check). None meets a rule, and all come from the species with ten times more genes and the fewest colonies.
Limitations, carried from each RESULT.md: n is about 10 colonies per species, and fewer in paired tests (6 to 9 in H06, H15 and H16), with one sample per layer per timepoint behind each per-colony change; several intervals resample genes, not colonies, and understate uncertainty. CpG density differs about 20-fold across species (D-008), so the A. pulchra and P. evermanni results rest on fewer, likely more methylated genes. Species is confounded with reference quality (P. evermanni N50 0.17 Mb; P. tuahiniensis mapped to P. meandrina), so species differences are not a ranking. The design is observational: TP1 and TP3 differ in temperature, light, nutrients and reproductive timing, and temporal precedence (H16) could not establish causation even if positive. In H23 the low-GBM percentiles of A. pulchra and P. evermanni come from a few hundred, probably mostly methylated, genes, and its checks disagree in sign. H24’s colony-bootstrap intervals hold the gene set fixed. GBM barely varies among colonies, so they are narrow and omit gene-sampling uncertainty, roughly ±0.2 on rho for the 91 A. pulchra–P. evermanni orthologs. Its shortfall below 0.30 and the 30-gene reversal are within that range. Persistence (H15) would need a manipulated exposure that induces a clear methylation shift.
6 Data and code availability
Each hypothesis directory holds hypothesis.md (with amendments), analysis.qmd, RESULT.md and output/:
- H04: methylation vs expression colony stability
- H05: GBM vs expression level and variability
- H06: within-colony coupling of seasonal change
- H15: persistence of seasonal shifts
- H16: cross-lagged direction
- H18: methylation and cis-lncRNA channels
- H23: species plasticity difference across GBM
- H24: conservation of GBM rank across orthologs
- Decision D-008 (unequal CpG filtering): docs/decisions.md
- Data portal: urol-e5/MOSAiC, commit
86432e3e393aecca307be356e514c95981177b7c
7 Suggested citation
Roberts, S. B. 2026. Gene-Body Methylation in Three Reef Corals Marks Stable Expression but Does Not Track Seasonal Change. Current Findings. Available at: https://robertslab.github.io/current-findings/reports/coral-gene-body-methylation-stable-not-seasonal/
8 Version history
| Version | Date | Notes |
|---|---|---|
| 0.1 | 2026-10-07 | Initial draft, synthesis of MOSAiC-hypotheses H04, H05, H06, H15, H16 and H18 |
| 0.2 | 2026-10-08 | Added the follow-up test H23 (species plasticity difference across GBM) |
| 0.3 | 2026-10-08 | Added the follow-up test H24 (conservation of GBM rank across orthologs) |