lncRNAs Co-vary with Neighboring Genes in Three Reef Corals, Mostly as Local Co-expression
A short non-peer-reviewed scientific report
This report is a Roberts Lab working manuscript. It has not been peer reviewed.
It is shared to make small scientific efforts, preliminary analyses, technical observations, and exploratory work openly available.
1 Abstract
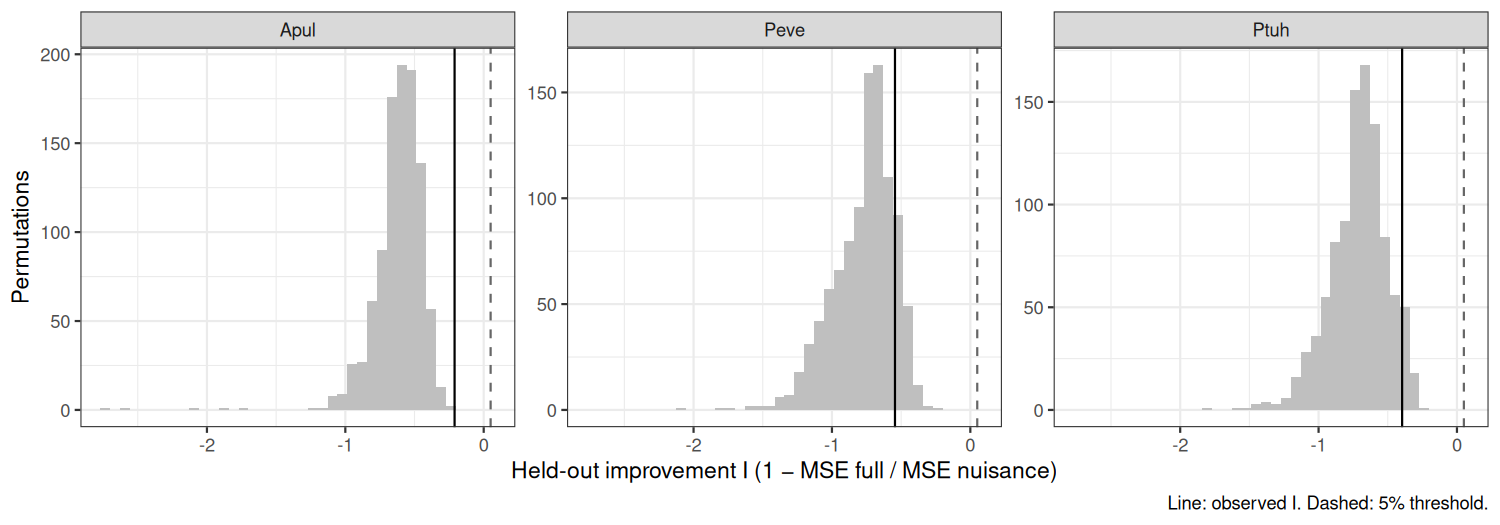
Long non-coding RNAs (lncRNAs) are often proposed to regulate neighboring genes in cis, usually on the basis of co-expression. We tested this claim as four pre-registered hypotheses (H08, H17, H25, H26) in the E5 MOSAiC time series: about 10 colonies each of Acropora pulchra, Porites evermanni and Pocillopora tuahiniensis, sampled four times across 2020 in Mo’orea, with lncRNA and gene expression from the same RNA-seq libraries (38–40 samples per species). Genome-wide (H08), strong lncRNA–mRNA correlations (|r| >= 0.8) number in the tens to hundreds of thousands per species, where label permutation produces almost none, but they track per-sample structure shared by both layers rather than lncRNA-specific co-regulation. Within colonies (H17), lncRNAs co-vary with protein-coding genes within 10 kb far more than with expression-matched genes on other scaffolds (median r 0.14 to 0.19 against null medians of 0.00 to 0.05), and the coupling falls steadily with distance in all three species. The pre-registered decision rule returns supported. However, a gene–gene control shows that neighboring protein-coding genes co-vary almost as strongly. The lncRNA-specific excess is concentrated within 2 kb of genes, where unannotated UTRs, read-through and antisense transcripts sit. Upstream lncRNA annotations carry no strand, so those cannot be separated from regulation. Two follow-ups sharpened this. A pre-registered equivalence test beyond 2 kb (H25, inconclusive) could not show that lncRNA–gene and gene–gene coupling are equivalent: after matching for distance and expression, lncRNA–gene coupling was about a third weaker in every species (intervals excluding 0 but crossing the ±25% margin). A held-out test (H26, not supported) found that distal lncRNA–gene associations selected in nine colonies made predictions for the tenth worse, not better, while the same pipeline with distal genes as predictors improved them by 25–52%. Cis co-variation is real but modest (about 2–4% of within-colony variance), most of it reflects local genomic co-expression, and we find no evidence for distal lncRNA associations that generalize across colonies.
2 Background
lncRNA function in non-model invertebrates is usually inferred from co-expression with nearby genes. Two problems make that inference weak. First, with few samples, strong correlations arise by chance. A companion pre-registered test (H08) showed that with about 40 samples per species, strong lncRNA–mRNA correlations do exceed a permutation null (see Results), but that genome-wide edges are dominated by per-sample library structure shared by both layers. Second, genes that sit close together tend to be co-expressed whatever they encode, because they share chromatin context. A cis claim for lncRNAs therefore needs both a null that keeps library structure and a comparison with gene–gene neighbors at the same distances.
3 Methods
Data. Gene and lncRNA count matrices, gene coordinates and lncRNA coordinates from the E5 MOSAiC data portal (pinned commit 86432e3). All samples with both layers: A. pulchra 40, P. evermanni 38, P. tuahiniensis 39; 10 colonies per species, four timepoints.
Pre-registration. Hypotheses, models and decision rules were committed before analysis (H08, H17, H25, H26). One dated amendment to H17, also written before analysis, records that the upstream lncRNA features have no strand. It drops the orientation analysis and fixes the details of the null. H25 and H26 were proposed on 2026-10-08 because H17’s gene–gene comparison raised the question, and pre-registered on 2026-10-09; they reuse the same data, so they are follow-ups, not replications. H26 excludes one P. evermanni locus on scaffold 167 that takes a median 69% of that species’ reads (MOSAiC-hypotheses decision D-017).
Genome-wide test (H08). Pearson r on vst values for every lncRNA × mRNA pair (1.7 to 3.3 × 10^8 pairs per species), counting pairs at |r| >= 0.8, 0.9 and 0.95, against 200 permutations of lncRNA sample labels (the decision null), a within-timepoint permutation, and a colony-residualized version.
Cis test (H17). Both layers were variance-stabilized (DESeq2 vst) on the same samples and residualized on colony, so correlations reflect within-colony co-variation across the year. For every lncRNA–gene pair on the same scaffold within 100 kb, we computed Pearson r. The test set was non-overlapping pairs within 10 kb (8,528 to 21,666 pairs per species). For each, 100 candidate null partners were drawn from genes on other scaffolds in the same mean-expression decile as the true neighbor. Each of 1000 null draws took one partner per pair and recorded the median r. Because null partners are measured in the same samples, per-sample library effects appear in both the observed and null values. The effect size is dr, the observed median r minus the mean null median. Pre-registered checks: residualizing timepoint as well, dropping all pairs within 2 kb, and repeating the whole procedure with gene–gene neighbor pairs.
Distal equivalence (H25). Pairs 2–100 kb apart (overlapping pairs and pairs within 2 kb removed), Pearson r of vst residualized on colony and timepoint, in bins of 2–10, 10–50 and 50–100 kb. lncRNA–gene pairs were compared with gene–gene pairs reweighted within strata of gap, the anchor gene’s expression, and the partner’s expression and residual noise. The statistic is the bin-averaged difference in median r divided by the bin-averaged gene–gene median. Equivalence was tested with two one-sided tests against a ±25% margin (2,000 colony-bootstrap resamples within site, Holm across species); a scaffold-block bootstrap assessed genomic dependence.
Held-out prediction (H26). lncRNAs at least 10 kb from any annotated gene, with at least 10 kb of assembled flank (297–1,317 per species). In each of 10 leave-one-colony-out folds, normalization and selection used the training colonies only: for each gene on another scaffold, its strongest isolated lncRNA after adjusting for colony, timepoint, log library size and the top-10-feature read fraction, keeping up to 100 targets with |r| ≥ 0.6. Mixed models with and without the lncRNA predicted the held-out colony; the statistic is the variance-scaled reduction in held-out error. The null reassigned whole lncRNA colony trajectories within site (1,000 of 14,399 permutations, the full pipeline re-run each time). Benchmark: the same pipeline with expression-matched isolated genes as predictors.
4 Results
4.1 Genome-wide co-expression exceeds chance (H08, supported)
| Species | Pairs at |r| >= 0.8 / 0.9 / 0.95 | Full-permutation null, 95th percentile |
|---|---|---|
| A. pulchra | 337,796 / 17,285 / 832 | 4 / 0 / 0 |
| P. evermanni | 65,442 / 3,707 / 586 | 4 / 0 / 0 |
| P. tuahiniensis | 91,823 / 2,203 / 282 | 32 / 0 / 0 |
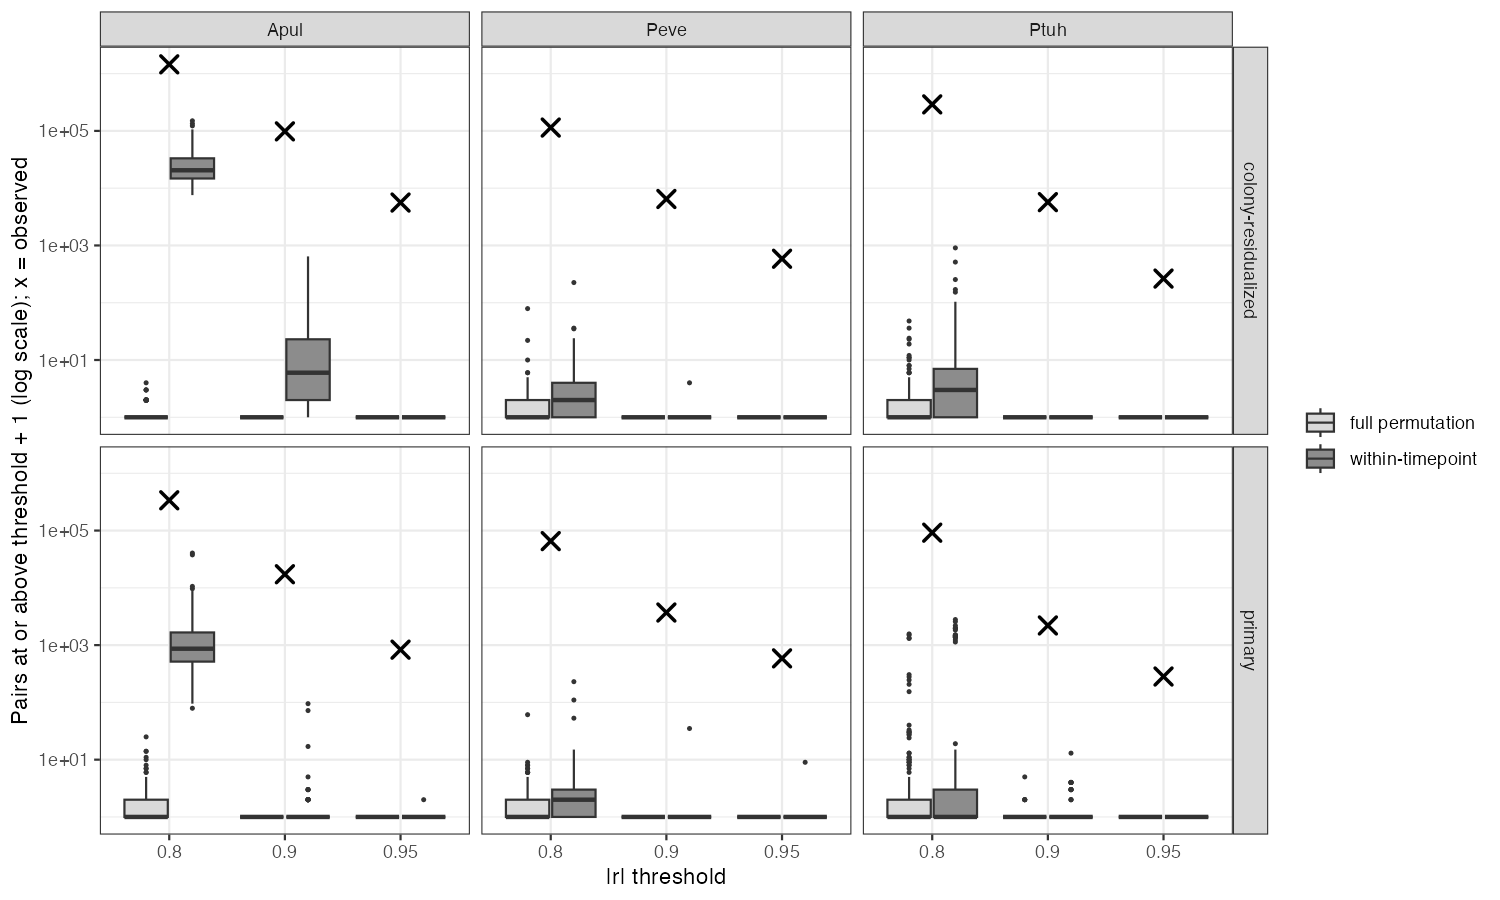
Observed counts exceed every null at every threshold in every species (Figure 1). Shared seasonal signal produces few strong edges (within-timepoint null medians 0 to 5 at |r| >= 0.9), and residualizing colony raises the counts (A. pulchra 338k to 1.45M at 0.8). Strong edges therefore come from sample-level variation below colony and season, where shared library effects (RNA integrity, composition) would also sit. This is why the cis test below uses a null measured in the same samples.
4.2 Cis co-variation with neighbors (H17, supported)
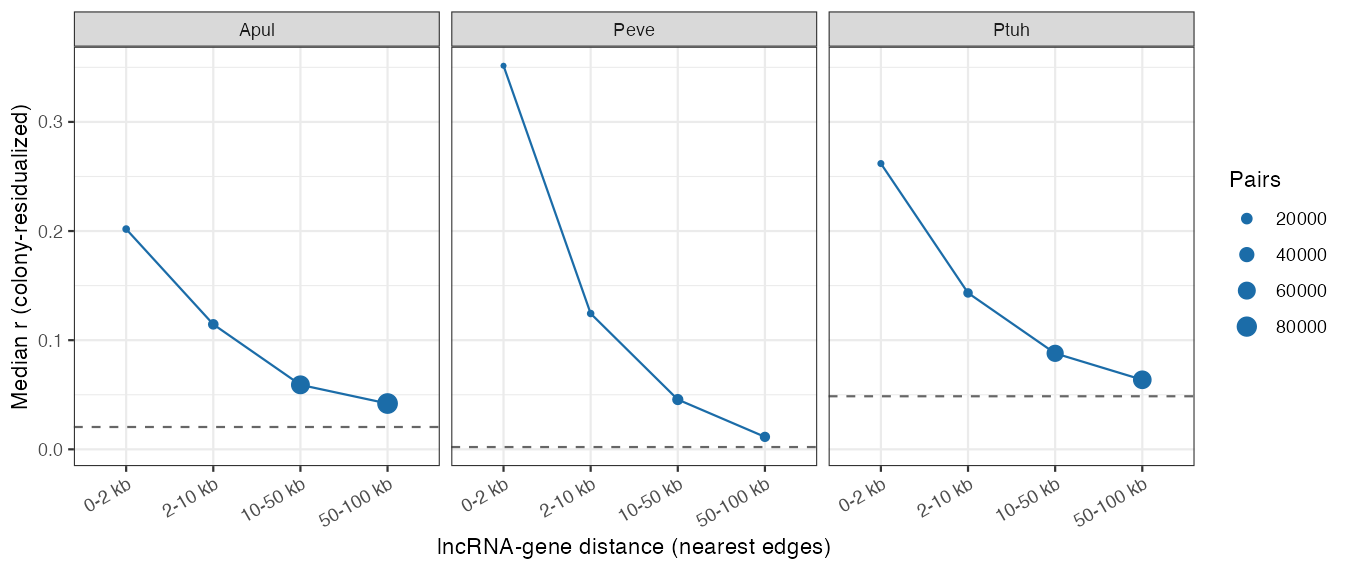
lncRNA–gene coupling within 10 kb exceeds the expression-matched null in all three species (one-sided p = 0.001, the floor, in each).
| Species | Median r, ≤ 10 kb | Null median | dr (95% interval) |
|---|---|---|---|
| A. pulchra | 0.138 | 0.020 | 0.117 (0.112–0.123) |
| P. evermanni | 0.193 | 0.002 | 0.191 (0.184–0.199) |
| P. tuahiniensis | 0.176 | 0.049 | 0.127 (0.121–0.133) |
Coupling decays monotonically with distance in every species (Figure 2). The result holds with timepoint also residualized and with all pairs within 2 kb removed (dr 0.09 to 0.19).
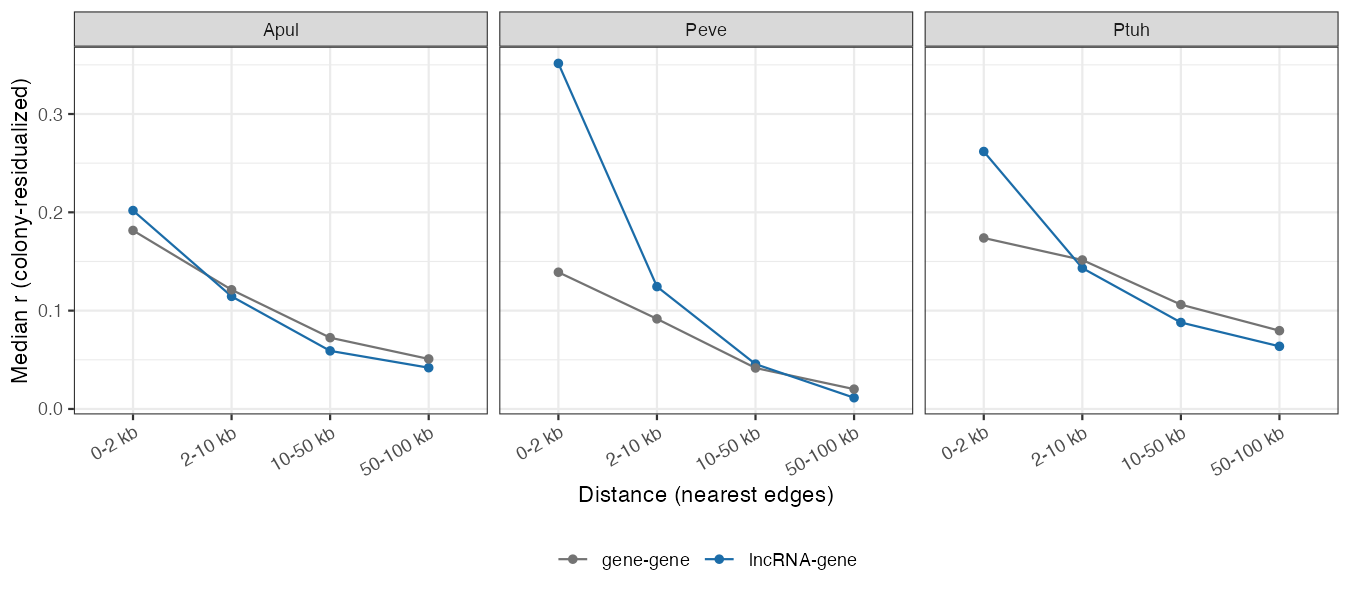
The gene–gene control changes the interpretation (Figure 3). Beyond 2 kb, lncRNA–gene pairs co-vary as much as neighboring gene–gene pairs do, and slightly less in A. pulchra and P. tuahiniensis. The lncRNA excess over gene–gene pairs is in the 0–2 kb bin: P. evermanni 0.35 vs 0.14, P. tuahiniensis 0.26 vs 0.17, A. pulchra 0.20 vs 0.18. Over the whole ≤ 10 kb set, lncRNA dr minus gene–gene dr is 0.009 (A. pulchra), 0.092 (P. evermanni) and 0.038 (P. tuahiniensis).
Pairs where the lncRNA overlaps the gene were excluded from the test. As expected from shared reads, they correlate strongly (median r 0.54 to 0.71).
4.3 Beyond 2 kb, equivalence is not established (H25, inconclusive)
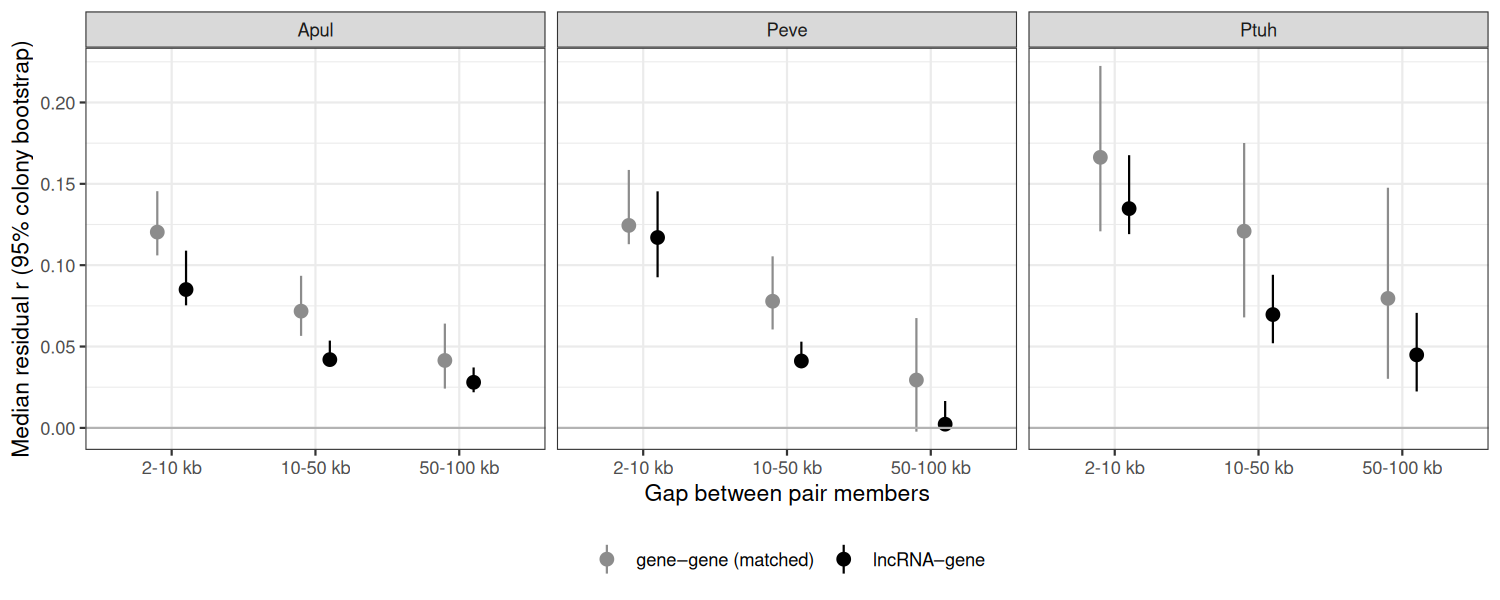
After matching, lncRNA–gene pairs co-vary less than gene–gene pairs in every species and distance bin (Figure 4). The relative difference is −0.34 (A. pulchra, 95% interval −0.48 to −0.13), −0.31 (P. evermanni, −0.47 to −0.10) and −0.32 (P. tuahiniensis, −0.42 to −0.05). No species establishes equivalence within ±25%, and no interval lies wholly beyond the margin, so the pre-registered verdict is inconclusive. Every interval excludes 0, in both colony and scaffold-block resampling, and the gap shrinks only slightly (by 0.05–0.07) when timepoint is left in. The descriptive comparison above, which did not match on expression, overstated how similar the two classes are beyond 2 kb.
4.4 Distal lncRNA associations do not generalize to new colonies (H26, not supported)
Every fold found 100 targets with |r| ≥ 0.6 to an isolated lncRNA (median selected |r| about 0.93), but adding that lncRNA made predictions for the held-out colony worse (Figure 5): improvement −0.21 (A. pulchra, 95% interval −0.71 to 0.30), −0.55 (P. evermanni, −0.91 to −0.18) and −0.40 (P. tuahiniensis, −0.79 to −0.14). The pre-registered verdict is not supported: the upper bound is below the 5% threshold in two species. In A. pulchra the selected pairs still did better than every permutation (p = 0.001), so they carry some reproducible association, but not enough to help prediction. Selection concentrated on a few lncRNAs (two supply 68% of A. pulchra’s pairs). With expression-matched isolated genes as predictors, the same pipeline improved held-out prediction by 0.52, 0.25 and 0.39, all with intervals above 0.
5 Discussion
The genome-wide result (H08) answers a methods question: with about 40 samples, strong correlations are not a small-sample artifact, unlike the n = 5 setting in which a published 0.99 cut sat near the null. It does not identify co-regulation. The data support cis co-variation between lncRNAs and nearby genes. They do not, by themselves, support cis regulation by lncRNAs. Most of the signal is what any two neighboring genes show, consistent with shared local chromatin or transcriptional neighborhoods. What remains specific to lncRNAs is concentrated within 2 kb of genes. That is the zone where an annotated “lncRNA” may be an unannotated UTR, a read-through transcript, or an antisense transcript. Each predicts near-gene correlation, but only the last is a plausible regulatory lncRNA. The near-gene excess is largest in P. evermanni, whose assembly is the most fragmented (N50 0.17 Mb) and whose gene models are likely the least complete, which fits an annotation explanation. Strand information would separate these cases, and we have asked upstream whether stranded coordinates exist (urol-e5/timeseries_molecular#139).
The follow-ups narrow what remains. Beyond 2 kb, lncRNAs are not more co-expressed with their neighbors than genes are; matched for expression they are about a third less so (H25), although the data cannot show whether that shortfall exceeds a quarter of the gene–gene signal. And the many strong distal lncRNA–mRNA correlations do not carry over to colonies not used to find them (H26), while distal gene–gene associations selected the same way do. Distal lncRNA edges in these data look like a few lncRNAs tracking broad expression axes, or shared library structure, rather than specific regulatory links. A less aggressive selection (fewer, stronger edges, or shrinkage) could behave differently and would be a new test.
Limitations: about 10 colonies per species (H26 tests each fold on 2–4 samples); pairs are not independent (one lncRNA can neighbor several genes); P. tuahiniensis reads are mapped to the P. meandrina reference; correlation cannot establish function, which needs perturbation. A practical recommendation for lncRNA studies in corals and other invertebrates is to report gene–gene neighbor co-expression at matched distances alongside any lncRNA cis claim.
6 Data and code availability
- Hypothesis, analysis and full results: urol-e5/MOSAiC-hypotheses, H17 (
hypothesis.md,analysis.qmd,RESULT.md,output/) - Genome-wide test: urol-e5/MOSAiC-hypotheses, H08
- Distal equivalence: urol-e5/MOSAiC-hypotheses, H25
- Held-out prediction: urol-e5/MOSAiC-hypotheses, H26
- Data portal: urol-e5/MOSAiC, commit
86432e3e393aecca307be356e514c95981177b7c
7 Suggested citation
Roberts, S. B. 2026. lncRNAs Co-vary with Neighboring Genes in Three Reef Corals, Mostly as Local Co-expression. Current Findings. Available at: https://robertslab.github.io/current-findings/reports/coral-lncrna-cis-coexpression/
8 Version history
| Version | Date | Notes |
|---|---|---|
| 0.1 | 2026-10-07 | Initial draft from MOSAiC-hypotheses H17 |
| 0.2 | 2026-10-08 | Added the genome-wide test (H08) |
| 0.3 | 2026-10-10 | Added distal equivalence (H25) and held-out prediction (H26); revised the beyond-2-kb statement |