Site Nutrient Context Shifts the Seasonal Physiology of Pocillopora, Less So Acropora, and Not Porites
A short non-peer-reviewed scientific report
This report is a Roberts Lab working manuscript. It has not been peer reviewed.
It is shared to make small scientific efforts, preliminary analyses, technical observations, and exploratory work openly available.
1 Abstract
Does nutrient enrichment change how reef corals move through the seasons? We tested this as a pre-registered hypothesis (H12) in the E5 MOSAiC physiology data. These cover 45–50 colonies each of Acropora pulchra, Porites evermanni and Pocillopora tuahiniensis, at three Mo’orea sites with low, medium and high nutrient levels, sampled across 2020. We modeled symbiont density, chlorophyll a and host biomass (ash-free dry weight, AFDW) with a timepoint × nutrient interaction and colony as a random effect. The pre-registered rule returns inconclusive. P. tuahiniensis shows the interaction in all three traits (FDR ≤ 0.006). A. pulchra shows it in two traits at FDR 0.057, just short of the 0.05 threshold. P. evermanni shows none: its high-nutrient colonies hold more symbionts and chlorophyll all year, but their seasonal trajectories run parallel to those at the low site. The largest single effect is in P. tuahiniensis biomass. From January to September it falls to 0.61 times the change seen at the low-nutrient site (95% CI 0.47–0.80), then recovers by November. Site and nutrient level are perfectly confounded, so these are site effects that may or may not be caused by nutrients.
2 Background
Nutrient enrichment is expected to raise symbiont density and alter host energetics, but whether it changes the seasonal trajectory of physiology, rather than just its level, is less clear. The MOSAiC time series samples the same colonies four times in 2020 (January, March, September, November) at three sites with different nutrient regimes. That allows a direct test of a timepoint × nutrient interaction with colony as a repeated unit. The physiology layer covers far more colonies than the molecular layers (about 10 colonies per species at two sites), so this is one of the better-powered tests in the project.
3 Methods
Data. The physiology layer of the E5 MOSAiC data portal (pinned commit 86432e3): symbiont cells per cm², chlorophyll a per cm² and host AFDW per cm², from 115–167 colony × timepoint samples per species. Colonies were sampled at 2–4 of the four timepoints.
Design. Every species × site cell had 15–19 colonies, far above the pre-registered minimum of three:
| Species | Hilton (medium) | Mahana (low) | Manava (high) |
|---|---|---|---|
| A. pulchra | 15 | 19 | 16 |
| P. evermanni | 15 | 16 | 15 |
| P. tuahiniensis | 15 | 15 | 15 |
Pre-registration. The model and decision rule were committed before analysis and applied without amendment (H12 hypothesis.md). For each species and trait, the model was lmer(log(trait) ~ timepoint * nutrient + (1|colony)). The interaction was tested with a likelihood-ratio test (6 df), with Benjamini–Hochberg correction across the three traits within species. The rule: supported if two of three traits reach FDR < 0.05 in at least two species; not supported if no interaction reaches FDR < 0.2 in any species; otherwise inconclusive. As an effect size we report the ratio of the January→September fold change at the high-nutrient site to that at the low-nutrient site, with a Wald 95% CI.
4 Results
| Species | Trait | χ² (6 df) | FDR | Jan→Sep change, high vs low (95% CI) |
|---|---|---|---|---|
| A. pulchra | symbiont density | 14.6 | 0.057 | 1.81 (1.25–2.64) |
| A. pulchra | chlorophyll a | 13.4 | 0.057 | 1.28 (0.87–1.88) |
| A. pulchra | host AFDW | 5.5 | 0.48 | 0.76 (0.51–1.15) |
| P. evermanni | symbiont density | 5.8 | 0.67 | 1.12 (0.74–1.69) |
| P. evermanni | chlorophyll a | 2.6 | 0.86 | 1.00 (0.66–1.52) |
| P. evermanni | host AFDW | 10.4 | 0.33 | 0.93 (0.65–1.31) |
| P. tuahiniensis | symbiont density | 18.3 | 0.0054 | 1.29 (0.81–2.06) |
| P. tuahiniensis | chlorophyll a | 27.2 | 0.0002 | 0.96 (0.66–1.40) |
| P. tuahiniensis | host AFDW | 37.6 | 4 × 10⁻⁶ | 0.61 (0.47–0.80) |
The pre-registered verdict is inconclusive: one species (P. tuahiniensis) meets the two-trait criterion, and A. pulchra has interactions at FDR < 0.2.
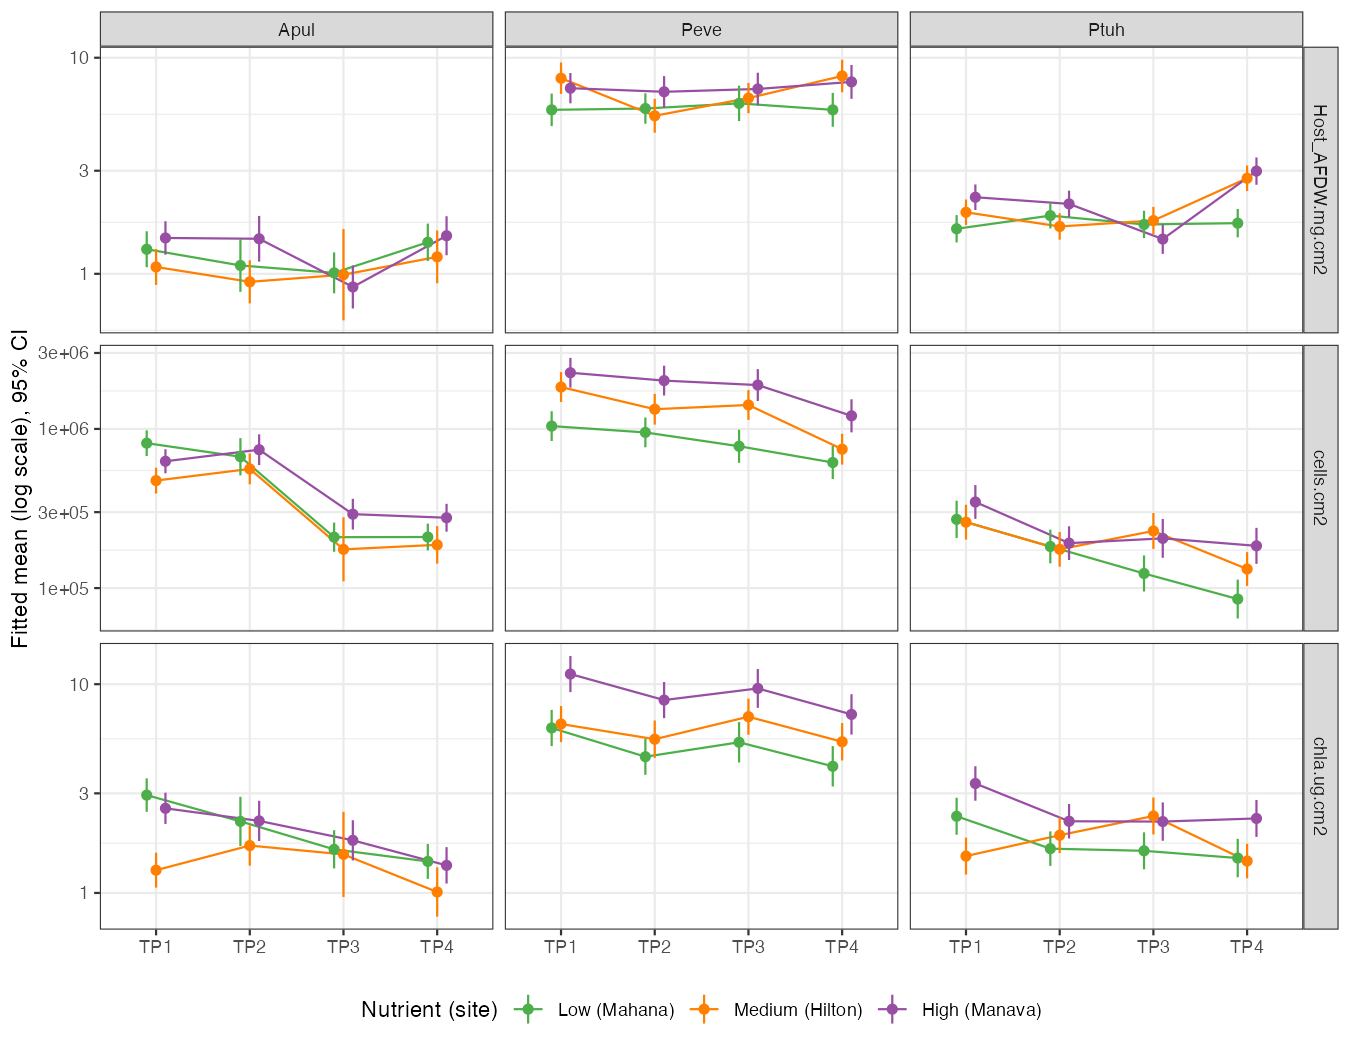
The trajectories (Figure 1) show three different patterns:
- Porites: a level effect only. High-nutrient P. evermanni colonies have more symbionts and chlorophyll at every timepoint, but all three sites change in parallel through the year.
- Pocillopora: trajectories diverge. High-nutrient P. tuahiniensis colonies lose biomass from January to September and recover by November, while low-nutrient colonies stay flat. Symbiont density declines steadily at the low-nutrient site but stays nearly flat after March at the high-nutrient site.
- Acropora: partly site idiosyncrasy. Symbiont density in A. pulchra falls less from January to September at the high-nutrient site (ratio 1.81). Part of the interaction comes from the medium-nutrient site, however: its January chlorophyll falls below both other sites, which does not fit a simple nutrient gradient.
Restricted to the two sites that also carry the molecular data (low vs high), the same pattern holds: P. tuahiniensis AFDW (FDR 8 × 10⁻⁶) and symbiont density (0.024), and A. pulchra symbiont density (0.002). This check was descriptive and not part of the pre-registered rule.
5 Discussion
The three genera respond to the same site contrast in different ways. Porites differs only in level: more symbionts where nutrients are higher, with an unchanged seasonal course. That fits its reputation as a physiologically conservative, stress-tolerant genus. Pocillopora changes its seasonal course, most clearly in host biomass, which dips through the cool season at the high-nutrient site and recovers. Acropora is intermediate, and its signal is partly driven by a site that is out of nutrient order. This mirrors the companion finding that Acropora is by far the most transcriptionally plastic of the three across the year (seasonal transcriptome report), but the physiology ranking here is Pocillopora > Acropora > Porites. Plasticity in gene expression and in physiology need not align.
The main limitation is that nutrient level is a site attribute. Each site has one nutrient level, so any other site difference (depth, flow, light, microhabitat, colony history) is indistinguishable from nutrient enrichment. The medium-nutrient site does not always fall between the other two, which argues for at least some site idiosyncrasy. Other limitations: colonies were sampled at 2–4 timepoints rather than all four, and Acropora sampling is uneven across the year (42 / 24 / 21 / 29 samples). The interaction test is joint over six degrees of freedom; the January→September ratio summarizes only one contrast of it. Separating nutrients from site would need replicate sites within each nutrient level or an enrichment experiment.
6 Data and code availability
- Hypothesis, analysis and full results: urol-e5/MOSAiC-hypotheses, H12 (
hypothesis.md,analysis.qmd,RESULT.md,output/) - Data portal: urol-e5/MOSAiC, commit
86432e3e393aecca307be356e514c95981177b7c
7 Suggested citation
Roberts, S. B. 2026. Site Nutrient Context Shifts the Seasonal Physiology of Pocillopora, Less So Acropora, and Not Porites. Current Findings. Available at: https://robertslab.github.io/current-findings/reports/coral-nutrient-site-seasonal-physiology/
8 Version history
| Version | Date | Notes |
|---|---|---|
| 0.1 | 2026-10-08 | Initial draft from MOSAiC-hypotheses H12 |