Seasonal Transcriptome Change Is Large in Acropora and Small, and Not Shared, in Porites and Pocillopora
A short non-peer-reviewed scientific report
This report is a Roberts Lab working manuscript. It has not been peer reviewed.
It is shared to make small scientific efforts, preliminary analyses, technical observations, and exploratory work openly available.
1 Abstract
Do reef corals differ in how much their gene expression changes across the year, and is the change they show a shared program? We tested three pre-registered hypotheses in the E5 MOSAiC time series: 10 colonies each of Acropora pulchra, Porites evermanni and Pocillopora tuahiniensis, sampled in January, March, September and November 2020 in Mo’orea (38–40 RNA-seq samples per species). On 9,017 three-way ortholog groups, H02 (supported) found 5,007 groups (55.5%) changing across timepoints in A. pulchra, against 505 (5.8%) in P. tuahiniensis and 414 (6.0%) in P. evermanni, with a median maximum |log2 fold change| of 0.88 against 0.58 and 0.56. The pre-registered rule tested a three-way ranking, but only the Acropora gap is large; Pocillopora and Porites are close. H01 (not supported) found that colony identity outweighs season in P. evermanni and P. tuahiniensis but not in A. pulchra, where season explains slightly more variance than colony. H03 (not supported) found that summer-to-winter changes at orthologs are weakly or negatively correlated between species (Spearman rho −0.08 to 0.23) with no shared enriched functions. Seasonal transcriptome plasticity in this system is species-specific: large in Acropora, small in the other two, and not a common cnidarian program. Each species has about 10 colonies, and species is confounded with reference-genome quality.
2 Background
Corals with different life histories are expected to respond differently to environmental change. Fast-growing, competitive taxa such as Acropora are often more stress-sensitive than massive, stress-tolerant Porites, with Pocillopora in between. If transcriptional plasticity follows the same axis, seasonal change in gene expression should rank Acropora > Pocillopora > Porites. Two further questions frame this. First, how large is seasonal change relative to the stable differences among colonies (H01)? Second, when species do respond, do orthologous genes move in the same direction, as a shared seasonal program would predict (H03)? Gene sets differ in size and annotation across species, so comparisons use three-way orthologs.
3 Methods
Data. Gene count matrices and three-way ortholog tables from the E5 MOSAiC data portal (pinned commit 86432e3). Samples: A. pulchra 40 (10 colonies × 4 timepoints), P. evermanni 38 (one colony missing TP3 and TP4), P. tuahiniensis 39 (one colony missing TP4); 5 colonies at each of two sites. Genes were kept with >= 10 counts in >= 25% of samples.
Pre-registration. Questions, models and decision rules were committed before analysis (H01, H02, H03). None of the three was amended.
Variance partition (H01). Per gene and species, variancePartition with ~ (1|colony) + (1|timepoint) + (1|site) on DESeq2 vst counts (all filtered genes, 20,796–21,108 per species). The rule compared median colony and timepoint fractions using 95% bootstrap intervals over genes. Checks: site dropped; three-way orthologs only.
Seasonal plasticity (H02). On the 9,017 ortholog groups common to all three species after filtering, DESeq2 per species with a likelihood-ratio test of ~ colony + timepoint against ~ colony (BH FDR 0.05). For each group, the maximum |log2 FC| over the six pairwise timepoint contrasts; species compared by Kruskal–Wallis and pairwise Wilcoxon (Hodges–Lehmann shift, Holm correction). The rule required both the DE count and the median max |LFC| to rank A. pulchra > P. tuahiniensis > P. evermanni, with significant adjacent tests. Checks: ortholog groups with average identity >= 60%; groups with a SwissProt name; reads downsampled to the lowest species median depth (8.75 M).
Conserved response (H03). TP3 (September) vs TP1 (January) contrasts from the H02 fits, with apeglm-shrunken log2 FC. Spearman rho for each species pair, tested against 1000 permutations of ortholog assignment, and GO-slim enrichment (Fisher, BH) among groups concordantly DE in both species of a pair. The rule required rho > 0.2 (permutation p < 0.01) in all pairs and at least three GO-slim terms enriched in all three concordant sets. Check: average identity >= 60%.
4 Results
4.1 Acropora is far more seasonally plastic (H02, supported)
| Species | Groups tested | DE across timepoints | Proportion DE (95% CI) | Median max |LFC| |
|---|---|---|---|---|
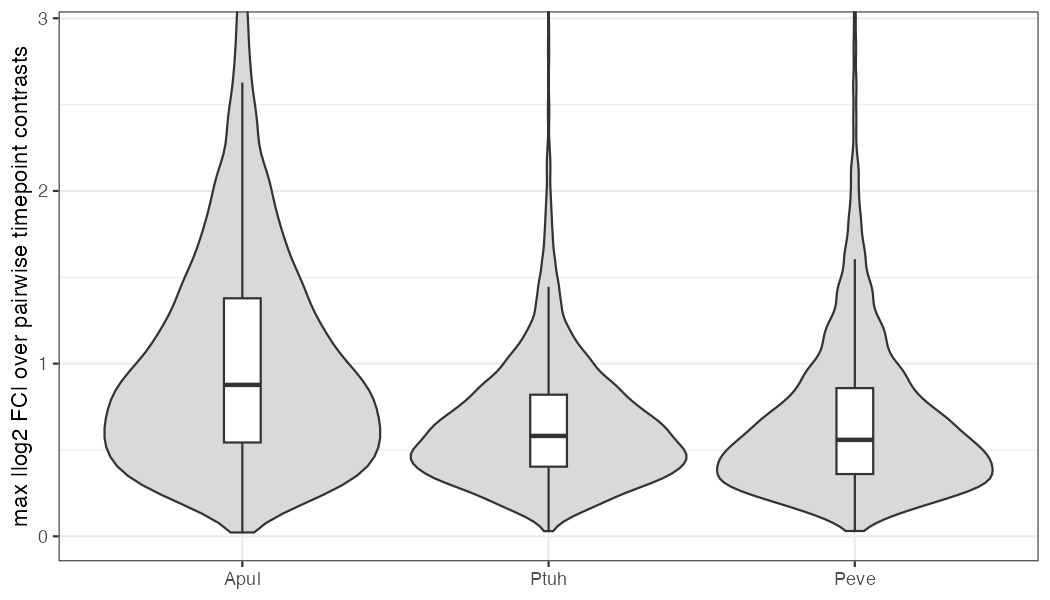
| A. pulchra | 9,017 | 5,007 | 0.555 (0.545–0.566) | 0.877 |
| P. tuahiniensis | 8,667 | 505 | 0.058 (0.053–0.063) | 0.581 |
| P. evermanni | 6,919 | 414 | 0.060 (0.054–0.066) | 0.559 |
Both orderings follow A. pulchra > P. tuahiniensis > P. evermanni, and both adjacent Wilcoxon tests are significant (Kruskal–Wallis chi-squared = 2314.9, df = 2), so the pre-registered rule returns supported. The two steps are very different in size (Figure 1). The max-|LFC| shift is 0.280 log2 units (95% CI 0.267–0.294) for A. pulchra over P. tuahiniensis, but 0.014 (0.004–0.023; Holm p = 0.004) for P. tuahiniensis over P. evermanni. All three pre-registered checks also return supported, and the Acropora gap is stable across them: DE counts 4,151 / 401 / 285 (identity >= 60%), 2,058 / 194 / 141 (SwissProt name), and 4,999 / 501 / 402 (downsampled).
4.2 Season outweighs colony only in Acropora (H01, not supported)
Median fraction of expression variance across genes (95% bootstrap CI over genes):
| Species | Colony | Timepoint | Residual |
|---|---|---|---|
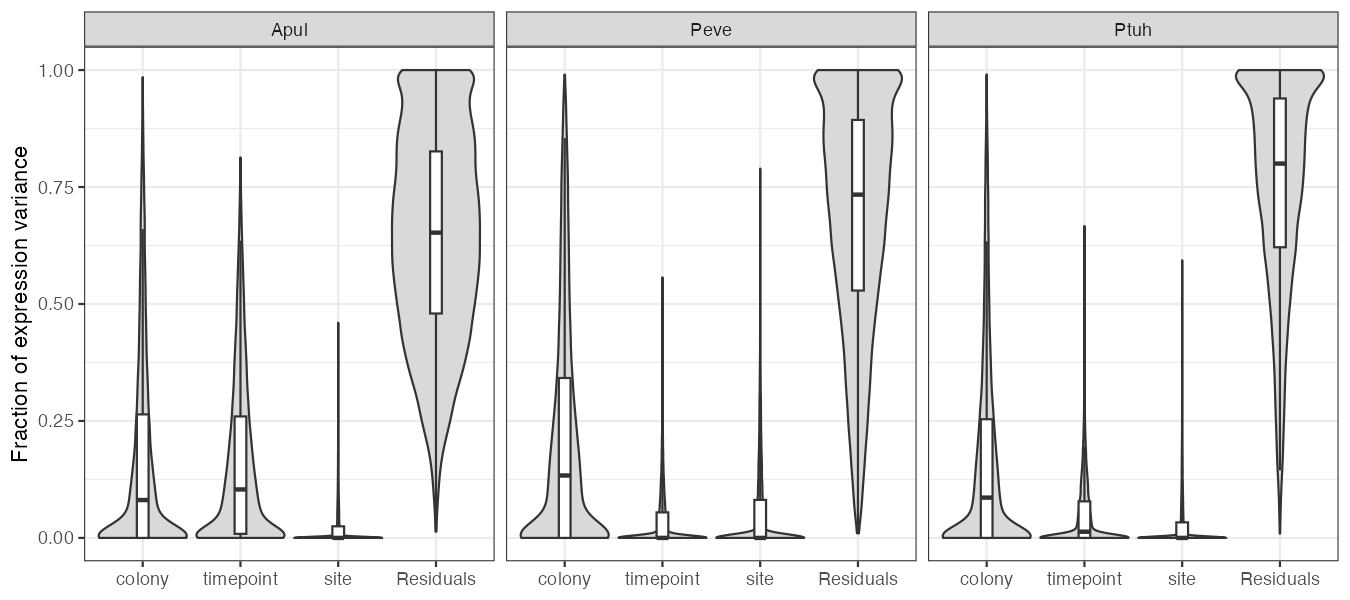
| A. pulchra | 0.081 (0.077–0.084) | 0.104 (0.101–0.107) | 0.65 |
| P. evermanni | 0.133 (0.130–0.138) | 0.00003 (0–0.001) | 0.73 |
| P. tuahiniensis | 0.086 (0.083–0.089) | 0.013 (0.012–0.015) | 0.80 |
The rule returns not supported because timepoint exceeds colony in A. pulchra (Figure 2). Colony dominates in the other two species. The A. pulchra ordering depends on how site is modeled: with site dropped, colony edges ahead (0.112 vs 0.100) and that check returns supported. On three-way orthologs only, the A. pulchra gap widens (timepoint 0.156 vs colony 0.025), and that check returns not supported.
4.3 Seasonal responses are not shared across species (H03, not supported)
| Pair | Spearman rho (95% CI) | Permutation p | Concordant DE groups | Enriched GO-slim terms |
|---|---|---|---|---|
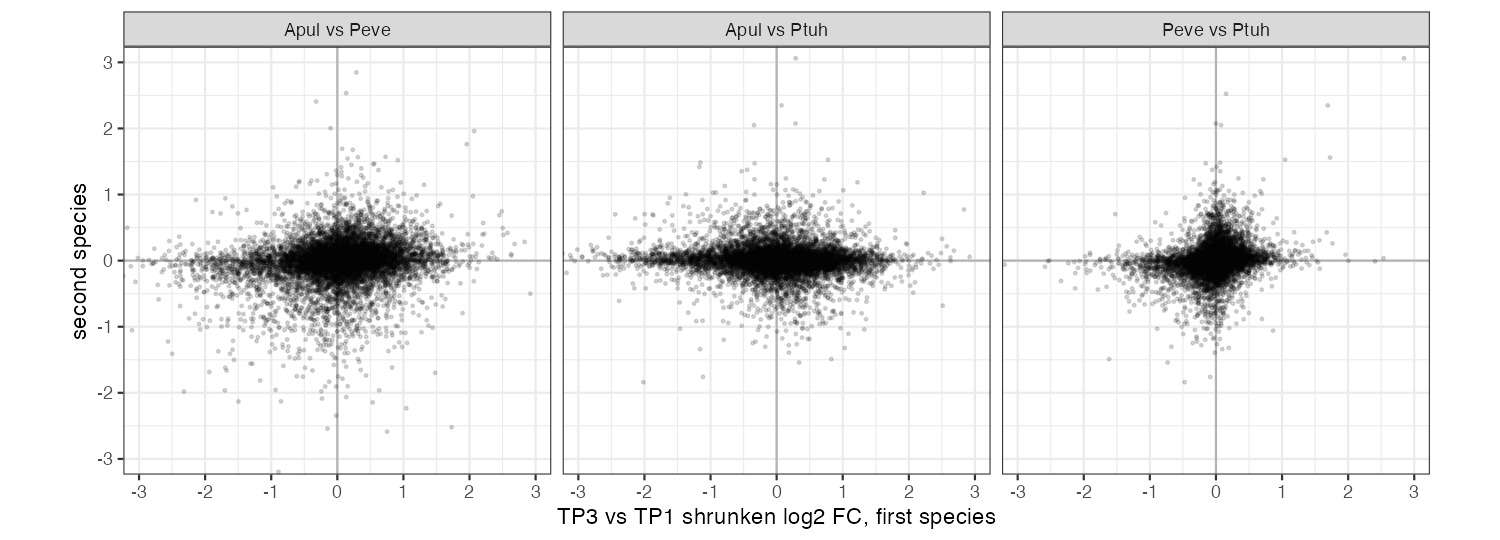
| A. pulchra–P. evermanni | 0.180 (0.160–0.198) | 0.001 | 91 | 0 |
| A. pulchra–P. tuahiniensis | −0.075 (−0.095 to −0.056) | 1.0 | 21 | 0 |
| P. evermanni–P. tuahiniensis | 0.235 (0.215–0.254) | 0.001 | 7 | 0 |
Only the Porites–Pocillopora pair passes the rho threshold, the Acropora–Pocillopora correlation is negative, and no GO-slim term is enriched in any pair (Figure 3). The rule returns not supported on both conditions independently. The identity >= 60% check gives the same picture (rho 0.176 / −0.077 / 0.238; not supported). TP3-vs-TP1 DE counts were 3,457 (A. pulchra), 791 (P. evermanni) and 224 (P. tuahiniensis).
5 Discussion
The three results agree on one point: seasonal transcriptome plasticity is species-specific. Acropora pulchra changes expression in over half of its conserved genes across the year, and in this species season accounts for roughly as much variance as colony identity. In Porites evermanni and Pocillopora tuahiniensis, about 6% of groups change and colony dominates. The Acropora response is not a stronger version of a program the other species share. It correlates weakly with Porites and runs slightly opposite to Pocillopora.
The pre-registered H02 rule tested a full three-way ranking and returned supported, but the data justify less. The Pocillopora > Porites step is a shift of about 1% in fold change, significant mainly because about 9,000 non-independent groups enter the test. The DE counts for these two species also reflect DESeq2 independent filtering (6,919 vs 8,667 groups tested). As a proportion of groups tested, the two are indistinguishable in the primary analysis, although P. tuahiniensis exceeds P. evermanni in the annotation subsets where both are tested on the same groups (5.5% vs 3.9% at identity >= 60%). The defensible claim is “Acropora is far more seasonally plastic than Pocillopora or Porites”, which fits the life-history expectation for Acropora but does not resolve the other two.
Similarly, the H01 verdict rests on A. pulchra, where the colony-vs-season ordering is close and flips when the two-level site term is dropped. The ortholog-only check suggests the Acropora seasonal signal sits in conserved genes and is not an artifact of reference quality. In H03, the negative Acropora–Pocillopora correlation is robust to ortholog identity, but the missing GO-slim enrichment is largely a power problem (concordant sets of 7 to 91 groups; about 40% of groups carry GO-slim annotation). The Porites–Pocillopora correlation, the strongest, comes from many small shifts in the species with the fewest DE genes. A shared non-biological factor such as collection day or sequencing batch could produce it as easily as shared biology.
Limitations: about 10 colonies per species. Bootstrap intervals in H01 resample genes, not colonies, and H02/H03 p-values treat non-independent groups as independent, so all intervals and p-values are optimistic. Species is confounded with reference-genome quality (P. evermanni N50 0.17 Mb; P. tuahiniensis reads mapped to P. meandrina). P. evermanni’s near-zero timepoint share may partly reflect its two missing late-year samples. Species-specific sequencing batches across timepoints cannot be separated from season. Timepoints differ in temperature, light, nutrients and reproductive timing, so none of these responses can be attributed to temperature.
6 Data and code availability
- Seasonal plasticity: urol-e5/MOSAiC-hypotheses, H02 (
hypothesis.md,analysis.qmd,RESULT.md,output/) - Variance partition: urol-e5/MOSAiC-hypotheses, H01
- Conserved seasonal response: urol-e5/MOSAiC-hypotheses, H03
- Data portal: urol-e5/MOSAiC, commit
86432e3e393aecca307be356e514c95981177b7c
7 Suggested citation
Roberts, S. B. 2026. Seasonal Transcriptome Change Is Large in Acropora and Small, and Not Shared, in Porites and Pocillopora. Current Findings. Available at: https://robertslab.github.io/current-findings/reports/coral-seasonal-transcriptome-plasticity/
8 Version history
| Version | Date | Notes |
|---|---|---|
| 0.1 | 2026-10-07 | Initial draft from MOSAiC-hypotheses H01, H02, H03 |