Symbiont Communities in Three Reef Corals Are Fixed by Colony, Not Season
A short non-peer-reviewed scientific report
This report is a Roberts Lab working manuscript. It has not been peer reviewed.
It is shared to make small scientific efforts, preliminary analyses, technical observations, and exploratory work openly available.
1 Abstract
Reef corals can in principle shuffle their Symbiodiniaceae communities as conditions change through the year. We tested, as a pre-registered hypothesis (H10), whether symbiont composition in the E5 MOSAiC time series is instead a fixed colony trait. Colonies of Acropora pulchra, Porites evermanni and Pocillopora tuahiniensis in Mo’orea were sampled in January, March, September and November 2020, and ITS2 type profiles were obtained for 120 to 162 samples per species. Colony identity explains most of the variation in community composition (PERMANOVA R2 0.885, 0.797 and 0.726), whereas timepoint explains less than 1% (R2 0.003 to 0.009, permutation p 0.26 to 0.68). A colony’s samples taken at different times are much more similar to each other than to other colonies sampled at the same time (p < 1e-7 in each species). The pre-registered decision rule returns supported. The prediction that Durusdinium-hosting colonies differ in physiology could not be tested as written, because P. evermanni and P. tuahiniensis are entirely Cladocopium-dominated. In A. pulchra, Durusdinium- and Symbiodinium-dominated samples showed no detectable difference in symbiont density or calcification.
2 Background
Whether coral–symbiont associations are flexible over seasonal timescales matters for how corals respond to warming: shuffling toward more thermotolerant symbionts is one proposed acclimatization route. It also matters for multi-omic time series. If symbiont communities shift across timepoints, they are a time-varying covariate for host molecular data; if they are fixed, they are a colony-level property. The MOSAiC design, with repeated sampling of the same colonies across a year, separates colony and season effects on symbiont composition directly.
3 Methods
Data. SymPortal ITS2 type-profile relative abundances and colony physiology from the E5 MOSAiC data portal (pinned commit 86432e3). All ITS2 samples were used. ITS2 covers more colonies than the molecular layers: A. pulchra 120 samples from 50 colonies (7 profiles), P. evermanni 162 samples from 45 colonies (23 profiles), P. tuahiniensis 159 samples from 45 colonies (15 profiles). About 10 colonies per species are the molecular colonies used in other MOSAiC analyses. Samples per timepoint (TP1–TP4) were 42/23/21/34 (A. pulchra), 44/42/40/36 (P. evermanni) and 40/42/39/38 (P. tuahiniensis).
Pre-registration. The hypothesis, model and decision rule were committed before analysis (H10 hypothesis.md). The rule: supported if R2(colony) > 0.5 and R2(timepoint) < 0.1 in all three species and within-colony distance is lower than between-colony distance at p < 0.01; not supported if R2(timepoint) ≥ R2(colony) in any species; otherwise inconclusive. The secondary physiology test is reported but does not affect the status. No amendments were made.
Analysis. Per species, Bray-Curtis dissimilarities were partitioned with sequential PERMANOVA (vegan::adonis2, bray ~ colony + timepoint, 999 permutations). The colony p-value used unrestricted permutations; the timepoint p-value used permutations blocked within colony, treating timepoint as a repeated measure. 95% intervals for R2 came from 500 bootstrap resamples of colonies. For each colony with at least two samples, we computed the mean dissimilarity among its own samples at different timepoints (within) and the mean dissimilarity from its samples to other colonies’ samples at the same timepoint (between). Within and between were compared across colonies with a one-sided paired Wilcoxon signed-rank test, with a Hodges-Lehmann shift and 95% interval. For the secondary test, each sample’s dominant genus was taken from its most abundant profile, and lmer(trait ~ dominant_genus + timepoint + (1|colony)) was fit for symbiont cell density (cells.cm2) and calcification (calc.umol.cm2.hr) where at least two genera each dominated five or more samples.
4 Results
Colony identity dominates symbiont composition in all three species, and timepoint explains almost nothing (Table 1).
| Species | R2 colony (95% CI) | R2 timepoint (95% CI), p | Within / between, median | Shift (95% CI) | p |
|---|---|---|---|---|---|
| A. pulchra | 0.885 (0.754–0.962) | 0.003 (0.001–0.024), 0.68 | 0 / 0.195 | −0.189 (−0.207 to −0.161) | 6.7e-8 |
| P. evermanni | 0.797 (0.690–0.882) | 0.006 (0.004–0.022), 0.30 | 0 / 0.619 | −0.480 (−0.596 to −0.402) | 9.2e-9 |
| P. tuahiniensis | 0.726 (0.645–0.801) | 0.009 (0.006–0.031), 0.26 | 0.5 / 0.798 | −0.504 (−0.588 to −0.398) | 1.3e-8 |
In A. pulchra and P. evermanni the median colony kept an identical profile composition across the year (median within-colony distance 0). P. tuahiniensis was the least fixed: its median within-colony distance of 0.5 indicates that about half its colonies changed dominant profile across the year, but these changes were still far smaller than differences between colonies (Figure 1). All three species meet every component of the decision rule.
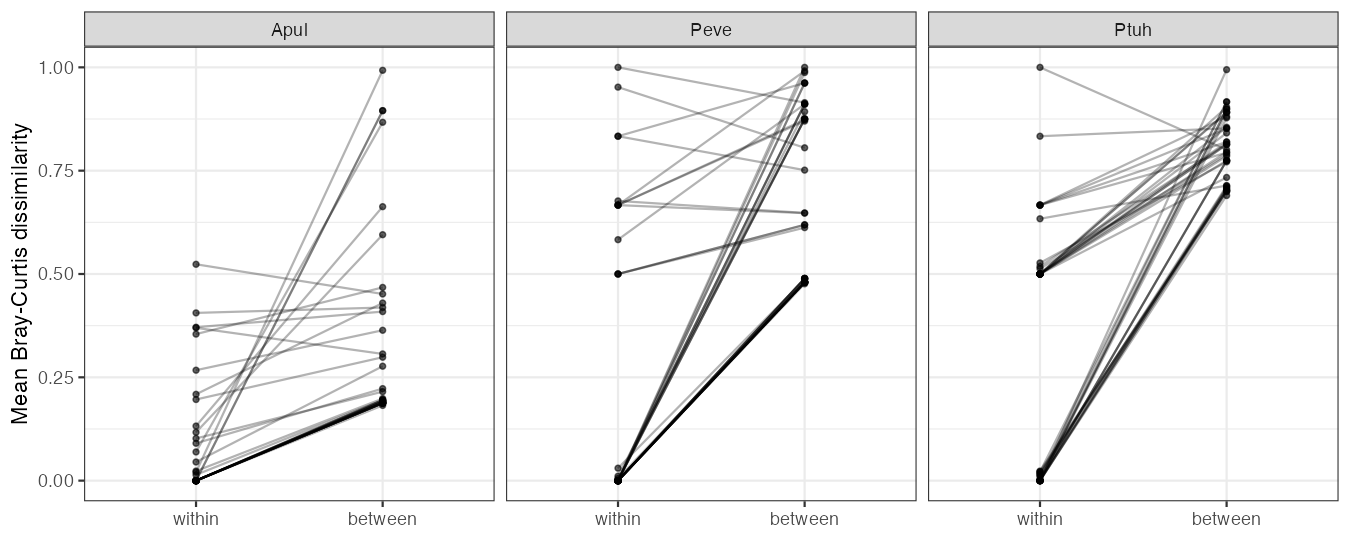
Secondary test. Only A. pulchra had more than one dominant genus: Durusdinium (102 samples) and Symbiodinium (18). P. evermanni and P. tuahiniensis were entirely Cladocopium-dominated, so the pre-registered Durusdinium vs Cladocopium contrast was not possible. In A. pulchra, Durusdinium-dominated samples did not differ detectably from Symbiodinium-dominated samples in symbiont density (+51,756 cells cm⁻², 95% CI −63,385 to 166,898, p = 0.38) or calcification (−0.052 µmol cm⁻² h⁻¹, 95% CI −0.115 to 0.012, p = 0.11).
5 Discussion
Across four sampling times spanning a year, symbiont communities in these three corals behaved as a colony trait rather than a seasonal variable. For the MOSAiC time series, this suggests symbiont identity can be treated as a fixed colony covariate in host molecular analyses, and that profile-level symbiont shuffling is an unlikely explanation for seasonal host signals.
The strength of the test differs by species. A. pulchra is close to the trivial case the pre-registration flagged: 85% of its samples carry one profile (D1-D1u-D1jb), so its colony R2 mostly reflects which colonies host Symbiodinium. P. evermanni (23 profiles) and P. tuahiniensis (15 profiles) are the more informative tests, and both still show strong colony fidelity. The 0.5 R2 threshold is also less stringent than it reads: with 45 to 50 colony levels, the null expectation for colony R2 is roughly 0.41 (A. pulchra), 0.27 (P. evermanni) and 0.28 (P. tuahiniensis). The unrestricted permutation test (p = 0.001) and the paired distance test, which does not share this inflation, both place colony far above that baseline.
Limitations: only about 10 of the 45 to 50 colonies per species are the molecular colonies analysed elsewhere in MOSAiC, where n is about 10 colonies per species. Coverage is uneven (A. pulchra TP2 and TP3 have about half the samples of TP1), and colonies sampled once enter PERMANOVA but not the paired test. SymPortal profiles can hide shifts in ITS2 sequence abundance within a profile, and relative abundances are compositional. The colony bootstrap ignores site. The secondary test covered one species and a genus contrast other than the one predicted, one of its models gave a near-singular fit warning, and it should be read as descriptive.
6 Data and code availability
- Hypothesis, analysis and full results: urol-e5/MOSAiC-hypotheses, H10 (
hypothesis.md,analysis.qmd,RESULT.md,output/) - Data portal: urol-e5/MOSAiC, commit
86432e3e393aecca307be356e514c95981177b7c
7 Suggested citation
Roberts, S. B. 2026. Symbiont Communities in Three Reef Corals Are Fixed by Colony, Not Season. Current Findings. Available at: https://robertslab.github.io/current-findings/reports/coral-symbiont-communities-colony-fixed/
8 Version history
| Version | Date | Notes |
|---|---|---|
| 0.1 | 2026-10-07 | Initial draft from MOSAiC-hypotheses H10 |