Let's Play With Data! (Part 1)
How do we know how oysters respond to changes in their environment? In the hatchery, we can place oysters in different conditions, or treatments. During the experiment, we collect information, or data. These data range from measurements of oyster shells to tracking when larvae are released from adult oysters! We can compare data collected from oysters in different treatments to understand how oysters will respond to that change!
In the activity below and the activity on the next tab, you’ll see some of the data we’ve collected from previous experiments, and try your hand at understanding it!
Part 1: How do changes in water acidity affect larvae growth?
Did you know the ocean is becoming more acidic because of climate change? When we talk about the ocean becoming more acidic, we say that the pH of the ocean decreases. Here in Washington, we’re interested in knowing how pH impacts oyster larvae. This is because the shell building blocks that larvae use to build their shells — calcium carbonate — become less available to them as pH decreases!
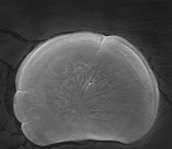
Image that shows cracks in an oyster larvae shell.
In one of our experiments, Pacific oyster larvae were placed in different pH treatments. At the end of our experiment, we took two measurements of the larvae’s shells: hinge length and shell depth (see image below). You can look at our data in the activity below! Click the treatment boxes to see what the shell measurements were for each group. The data for a pH group will pop up in different colors. Look at the length or depth on the horizontal, or x-axis, and the number of larvae on the vertical, or y-axis. Are some groups smaller than others? How do you think lower pH impacted shell measurements? You can also adjust the way the data is grouped together in the graphs by using the sliders to change the number of size bins. When you make the number of size bins larger, how does that change the graph? Is it easier to look at differences when there are more or less bins?
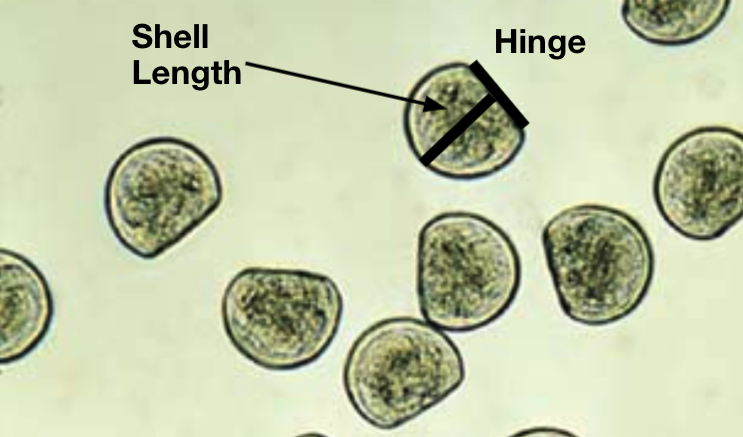
Image of larval oysters under a microscope. The image is labeled with how the shell length (shell depth) and hinge length are measured.
Once you interact with the data on the tab called "Part 1: Undertanding Distributions", take your best guesses at the questions and see how much you learned!