Continuing with the RAD-seq library prep. Following the Meyer Lab 2bRAD protocol.
Prior to generating full-blown libraries, we needed to run a “test-scale” PCR to identify the minimum number of cycles needed to produce the intended product size (166bp).
I ran PCR reactions on a subset (Sample #: 2, 3, & 4) of the 10 samples that I performed adaptor ligations on Friday.
PCR reactions were set up on ice in 0.5mL PCR tubes.
| REAGENT | SINGLE REACTION (μL) | x4.4 |
| Template | 8 | NA |
| NanoPure H2O | 1 | 4.4 |
| dNTPs (1mM) | 4 | 17.6 |
| ILL-LIB1 (10μM) | 0.4 | 1.76 |
| ILL-LIB2 (10μM) | 0.4 | 1.76 |
| ILL-HT1 (1μM) | 1 | 4.4 |
| ILL-BC1 (1μM) | 1 | 4.4 |
| 5x Q5 Reaction Buffer | 4 | 17.6 |
| Q5 DNA Polymerase | 0.2 | 0.88 |
| TOTAL | 20 | 52.8 |
Combined 12μL of master mix with 8μL of the ligation reaction from earlier today.
Cycling was performed on a PTC-200 (MJ Research) with a heated lid:
| STEP | TEMP (C) | TIME (s) |
| Initial Denaturation |
|
|
| 27 cycles |
|
|
We’re following the “1/4 reduced representation” aspect of the protocol. As such, 5μL of each reaction was pulled immediately after the extension (72C – machine was paused) of cycles 12, 17, 22, & 27 in order to determine the ideal number of cycles to use. Also ran the ligation reactions (labeled “Ligations” on the gel below) of the samples as a pre-PCR comparison. Treated them the same as the PCR reactions: mixed 8μL of the ligation with 12μL of H2O, used 5μL of that mix to load on gel.
These samples were run on a 1x modified TAE 2% agarose gel (w/EtBr).
Results:
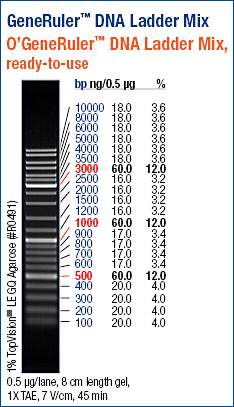
 (https://raw.githubusercontent.com/sr320/LabDocs/master/protocols/Commercial_Protocols/ThermoFisher_OgeneRuler_DNA_Ladder_Mix_F100439.jpg)
[caption id=“” align=“alignnone” width=“698”] (http://eagle.fish.washington.edu/Arabidopsis/20151012_RAD_test_scale_PCR.jpg) Test-scale PCR gel. Green arrow indicates desired band. The numbers below the headings indicate the sample number.[/caption]
This looks pretty good. The green arrow on the gel indicates the desired band size (~166bp). Although difficult to see on this gel image, there is a gradient in band intensities across the cycles (band intensity increases as cycle number increases). Looks like we can use 12 cycles for our PCRs.
One other aspect of this gel that is very interesting is the ligations. The three ligation samples all show an intact high molecular weight band! This is very surprising, since the input gDNA from these three samples does not look this.