Using the C.gigas cytochrome c oxidase (COX1) primers (SR IDs: 1713, 1714)I designed the other day, I ran a qPCR on a subset of Ronit’s diploid/triploid control/heat shocked oyster DNA that Shelly had previously isolated and performed global DNA methylation assay. The goal is to get a rough assessment of whether or not there appear to be differences in relative mitochondrial abundances between these samples.
I used 50ng (2uL) of DNA in each qPCR reaction. The DNA had been previously diluted to 25ng/uL by Shelly when performing her DNA methylation assay (Google Sheet), however I did need to prepare a dilution for sample T02 (control, triploid), as there wasn’t an existing 25ng/uL dilution in her box:
5.54uL stock DNA (27ng/uL )
0.46uL H2O
qPCR master mix calcs (Google Sheet):
All samples were run in duplicate using 2x SsoFast EVAGreen Master Mix (BioRad) on the Roberts Lab CFX Connect. Plate layout, cycling params, etc can be seen in the qPCR Report (see Results below).
Ronit’s master spreadsheet that describes all samples is here (Google Sheet):
Samples used for this qPCR (samples starting with “D” are diploid and starting with “T” are triploid):
- D01 (control)
- D02 (control)
- D19 (heat stressed)
- D20 (heat stressed)
- T01 (control)
- T02 (control)
- T19 (heat stressed)
- T20 (heat stressed)
RESULTS
qPCR Report (PDF):
qPCR Data File (PCRD - Requires CFX Maestro):
qPCR Data (CSV):
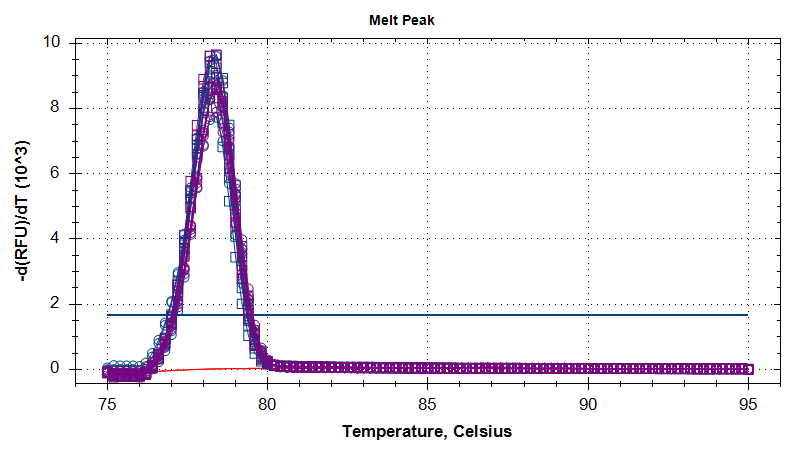
Firstly, as this is the first time these primers are being used, their performance looks good, based on the melt curves (see below); nice, tight single peak.
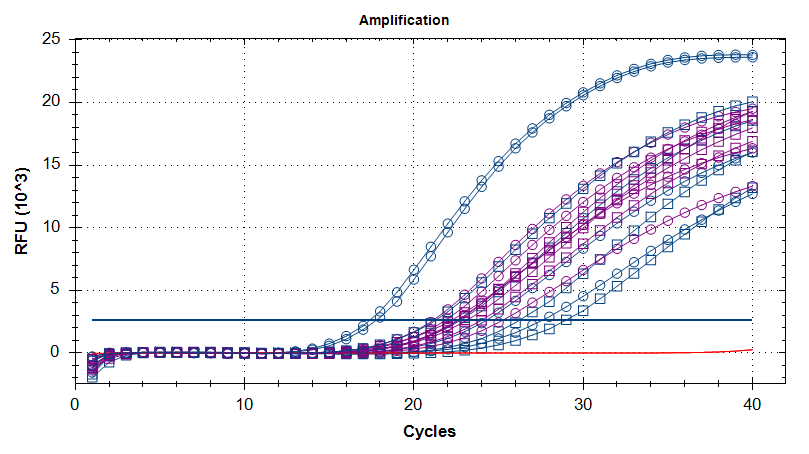
Overall, the qPCRs don’t look that great. Technical reps are remarkably bad, which is surprising and disappointing.
The data, via a quick visual assessment of differences between the various sample groups (see table below), suggests that there could be a difference between heat stressed diploid and triploid COX1 (i.e. mitochondrial abundance) numbers, however, there is a remarkably wide spread between biological replicates, as well as technical replicates. No statistical analysis was performed to compare these groups.
Due to potential differences between the aforementioned groups, the large differences in biological replicates, and poor performance of technical replicates, this certainly warrants further work; likely isolation of additional DNA (Shelly’s T02 stock sample was essentially depleted to make working dilutions for these qPCRs) and repeat of the qPCR to improve technical replicates.
TABLE
Summary table of means of replicate Cq values. Values have been grouped on various categories (table headers). A mean Cq value for each category is provided at the bottom of the respective column.
| Controls | HS | Diploid | Triploid | Control Diploid | Control Triploid | HS diploid | HS triploid | |
|---|---|---|---|---|---|---|---|---|
| 21.54 | 25.98 | 21.54 | 23.36 | 21.54 | 23.36 | 25.98 | 22.05 | |
| 23.94 | 17.62 | 23.94 | 22.73 | 23.94 | 22.73 | 17.62 | 27.64 | |
| 23.36 | 22.05 | 25.98 | 22.05 | |||||
| 22.73 | 27.64 | 17.62 | 27.64 | |||||
| MEAN Cqs | 22.89 | 23.32 | 22.27 | 23.95 | 22.74 | 23.04 | 21.80 | 24.85 |
AMPLIFICATION PLOTS
Blue: heat stressed
Purple: controls
Red: no template controls (NTC)
Circles: diploids
Squares: triploids

MELT CURVES
