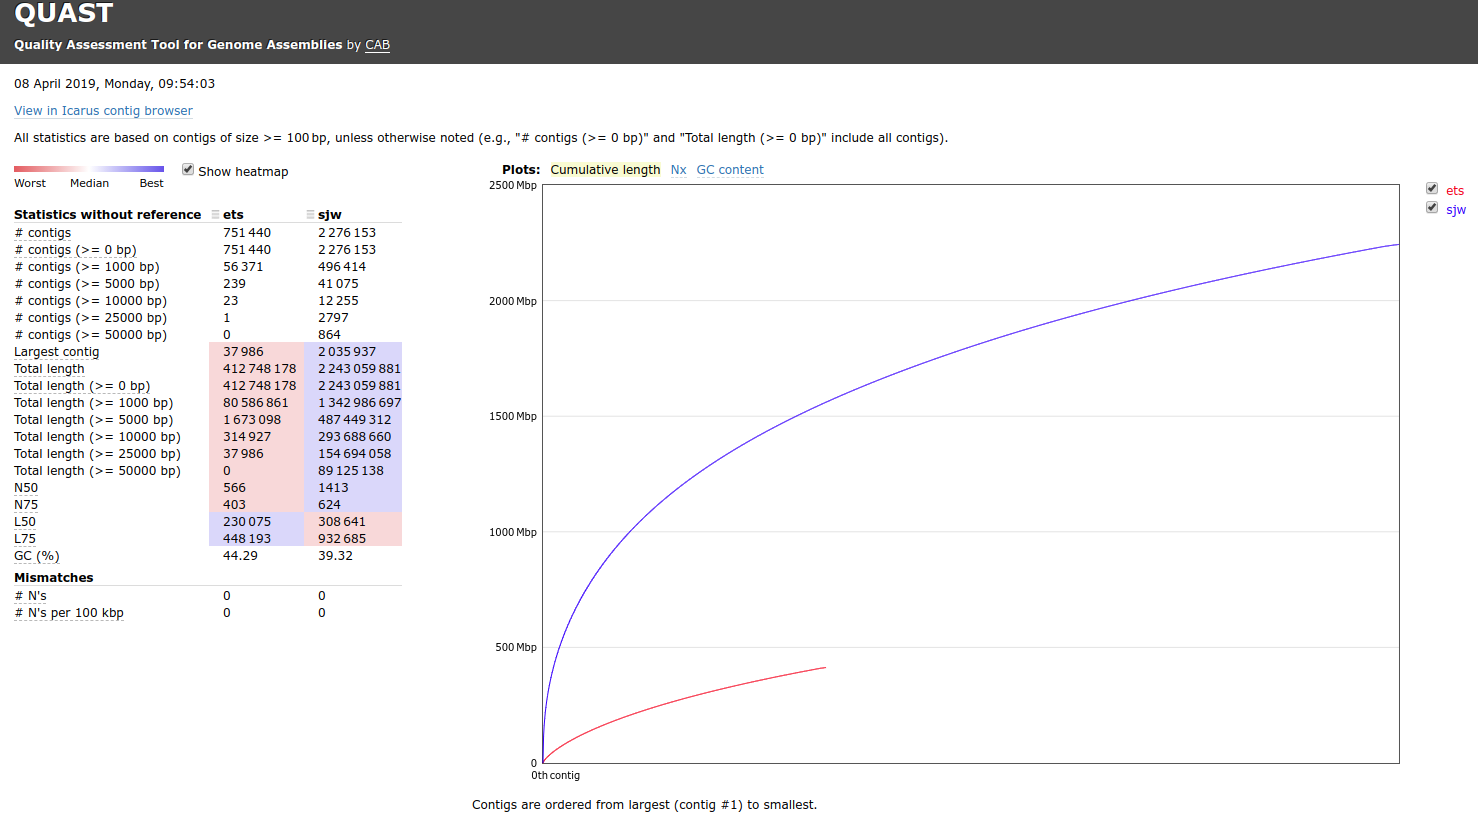
Continuing work on the metagenomics project, Emma shared her “co-assembly”, so I figured it would be quick and easy to compare hers with mine and get a feel for how different/similar they might be. I did a similar comparison last week where I compared each of our individual water sample assemblies. Those results showed my assemblies generated:
significantly larger “largest contigs” (10 - 50x larger than Emma’s)
larger N50 values (~2x larger than Emma’s)
total length in bps (~1.5x more than Emma’s)
So, I ran Quast on my computer (swoose - Ubuntu 16.04LTS) with the following input FastAs:
contigs.fa (Emma’s)
final.contigs.fa (Mine from 20190102_metagenomics_geo_megahit)
python \
/home/sam/programs/quast-5.0.2/quast.py \
--threads=20 \
--min-contig=100 \
--labels=ets,sjw \
/home/sam/data/metagenomics/P_generosa/emma_assemblies/contigs.fa \
/home/sam/data/metagenomics/P_generosa/final.contigs.fa
Here’s how the sample names breakdown:
| Sample | Develomental Stage (days post-fertilization) | pH Treatment |
|---|---|---|
| MG1 | 13 | 8.2 |
| MG2 | 17 | 8.2 |
| MG3 | 6 | 7.1 |
| MG5 | 10 | 8.2 |
| MG6 | 13 | 7.1 |
| MG7 | 17 | 7.1 |
RESULTS
Output folder:
Quast report (HTML):

Well, these results are very strange. The thing that immediately jumps out to me is how “small” Emma’s assembly is. My assembly has nearly 5x the number of bases as hers does (2.2Gbp vs 412Mbp). This is an enormous disparity between the two assemblies. I’ll talk to Emma and try to get explicit details on how she constructed her assembly.