Shelly ordered some new primers (designed by Sam Gurr) (GitHub Issue) to potentially use as normalizing genes for her geoduck reproduction gene expression project and asked that I test them out.
Primers tested:
| SRID | Primer_Name |
|---|---|
| 1803 | 28s_v1_FWD |
| 1802 | 28s_v1_REV |
| 1801 | 28s_v2_FWD |
| 1800 | 28s_v2_REV |
| 1799 | 28s_v3_FWD |
| 1798 | 28s_v3_REV |
| 1797 | 28s_v4_FWD |
| 1796 | 28s_v4_REV |
| 1795 | EF1a_v1_FWD |
| 1794 | EF1a_v1_REV |
| 1793 | EF1a_v2_FWD |
| 1792 | EF1a_v2_REV |
| 1791 | EF1a_v3_FWD |
| 1790 | EF1a_v3_REV |
| 1789 | EF1a_v4_FWD |
| 1788 | EF1a_v4_REV |
I used pooled cDNA, created by combining 2uL from a variety of cDNA previously made by Kaitlyn (sorry, didn’t document which samples contributed this time…).
I also used a 1:10 dilution of geoduck gDNA (162ng/uL; from 20170105) as a potential positive control, and/or as confirmation that these primers will/not amplify gDNA.
Master mix calcs are here:
- 200200914_qPCR_geoduck_28s-v1-4_EF1a-v1-4 (Google Sheet)
All qPCR reactions were run in duplicate. See qPCR Report (Results section below) for plate layout, cycling params, etc.
RESULTS
qPCR Report (PDF):
CFX Data File (PCRD):
CFX Results File (CSV):
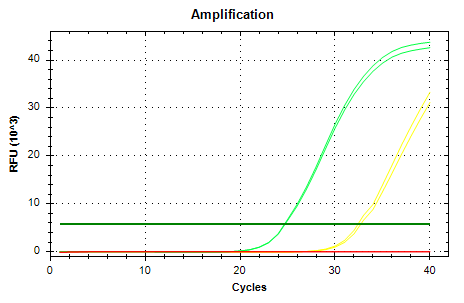
Overall, all primer sets amplified gDNA and cDNA. All melt curves look really good, although for 28s I’d lean towards using 28s v4 due to the fact that the melt curve doesn’t mirror the gDNA melt curve like the others do. For the same reasons, I’d lean towards using EF1a v1.
Amplifcation and melt plots for each primer set are below. Color coding:
RED: No Template Control (NTC)
CHARTREUSE: gDNA
OTHER: cDNA
28s v1
AMPLIFICATION PLOTS

MELT PLOTS

28s v2
AMPLIFICATION PLOTS

MELT PLOTS

28s v3
AMPLIFICATION PLOTS

MELT PLOTS

28s v4
AMPLIFICATION PLOTS

MELT PLOTS

EF1a v1
AMPLIFICATION PLOTS

MELT PLOTS

EF1a v2
AMPLIFICATION PLOTS

MELT PLOTS

EF1a v3
AMPLIFICATION PLOTS

MELT PLOTS

EF1a v4
AMPLIFICATION PLOTS

MELT PLOTS
