Intro
As part of the CEABIGR project (GitHub repo) Steven performed some inital data wrangling to test out the basic calculations to determine the natural log of the fold change in exon expression, relative to Exon 1, for each gene in a single sample. The decision to perform the calculation in this manner was based on (Li et al. 2018). I took the next steps to perform this across all samples, as well as generate some comparison plots. After this, will explore how spurious transcription relates to methylation levels across genes.
See 65-exon-coverage.qmd for code.
Code and plots link to commit 585fb03.
Plots
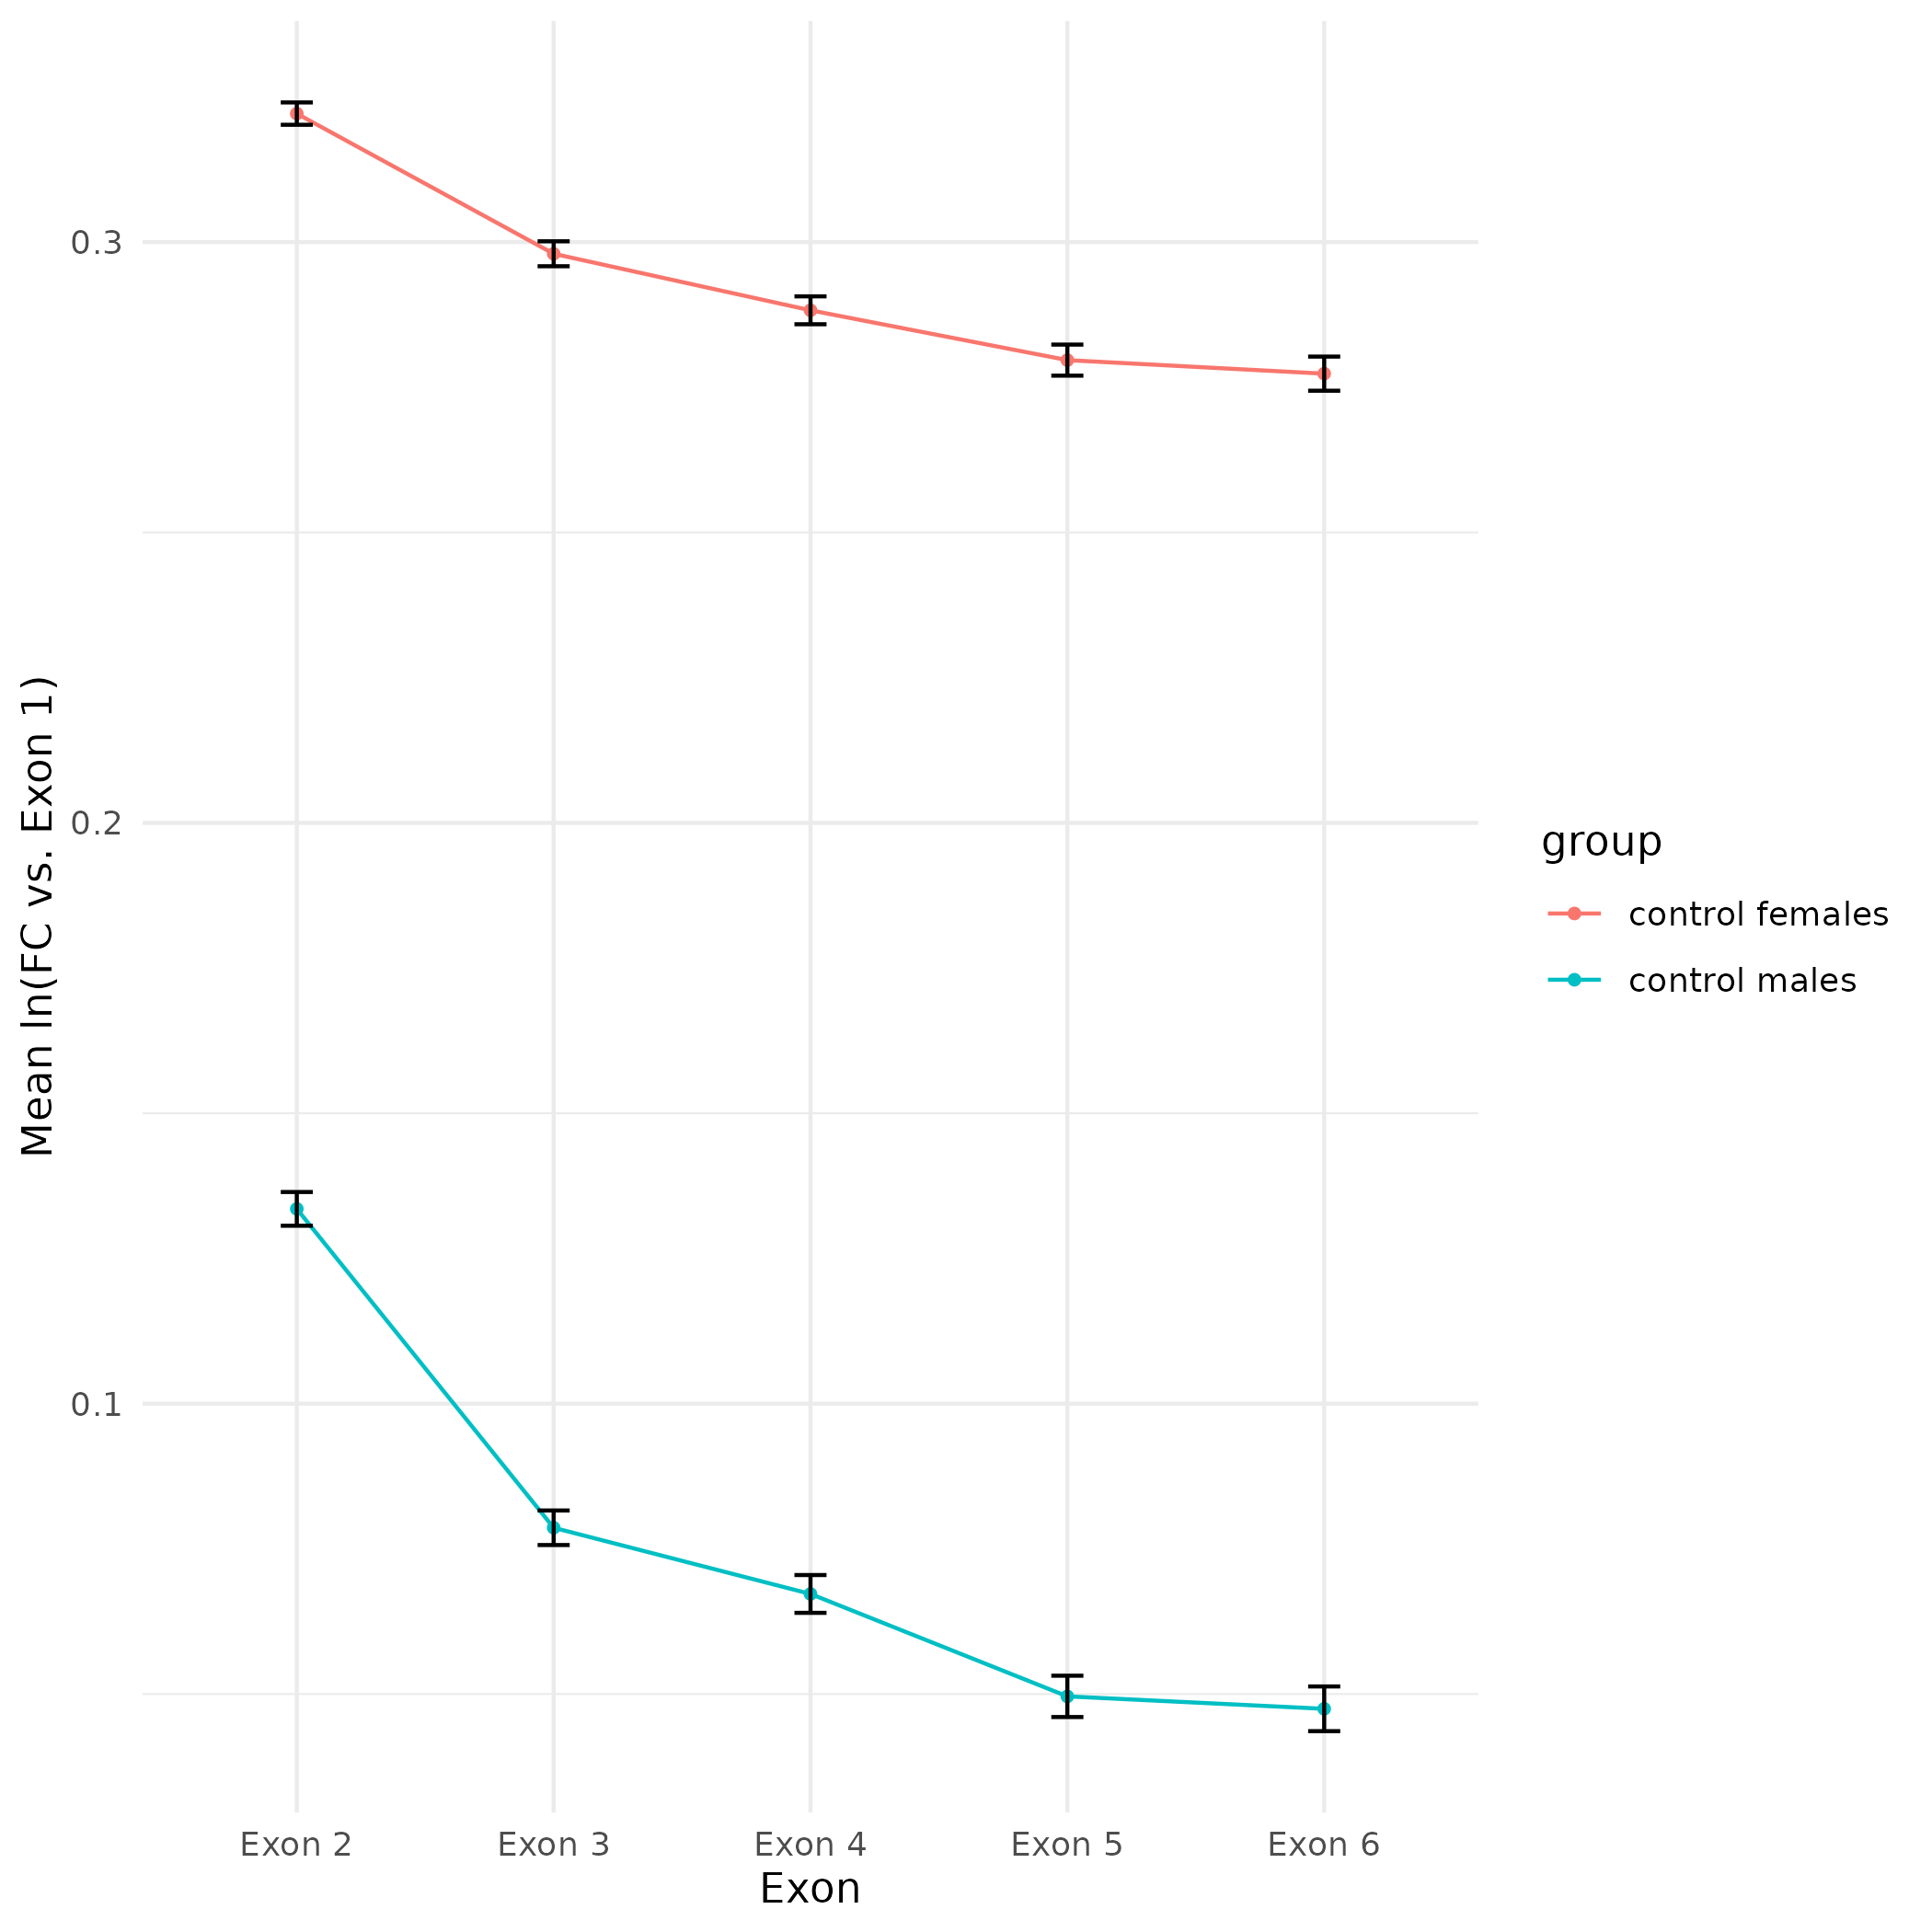
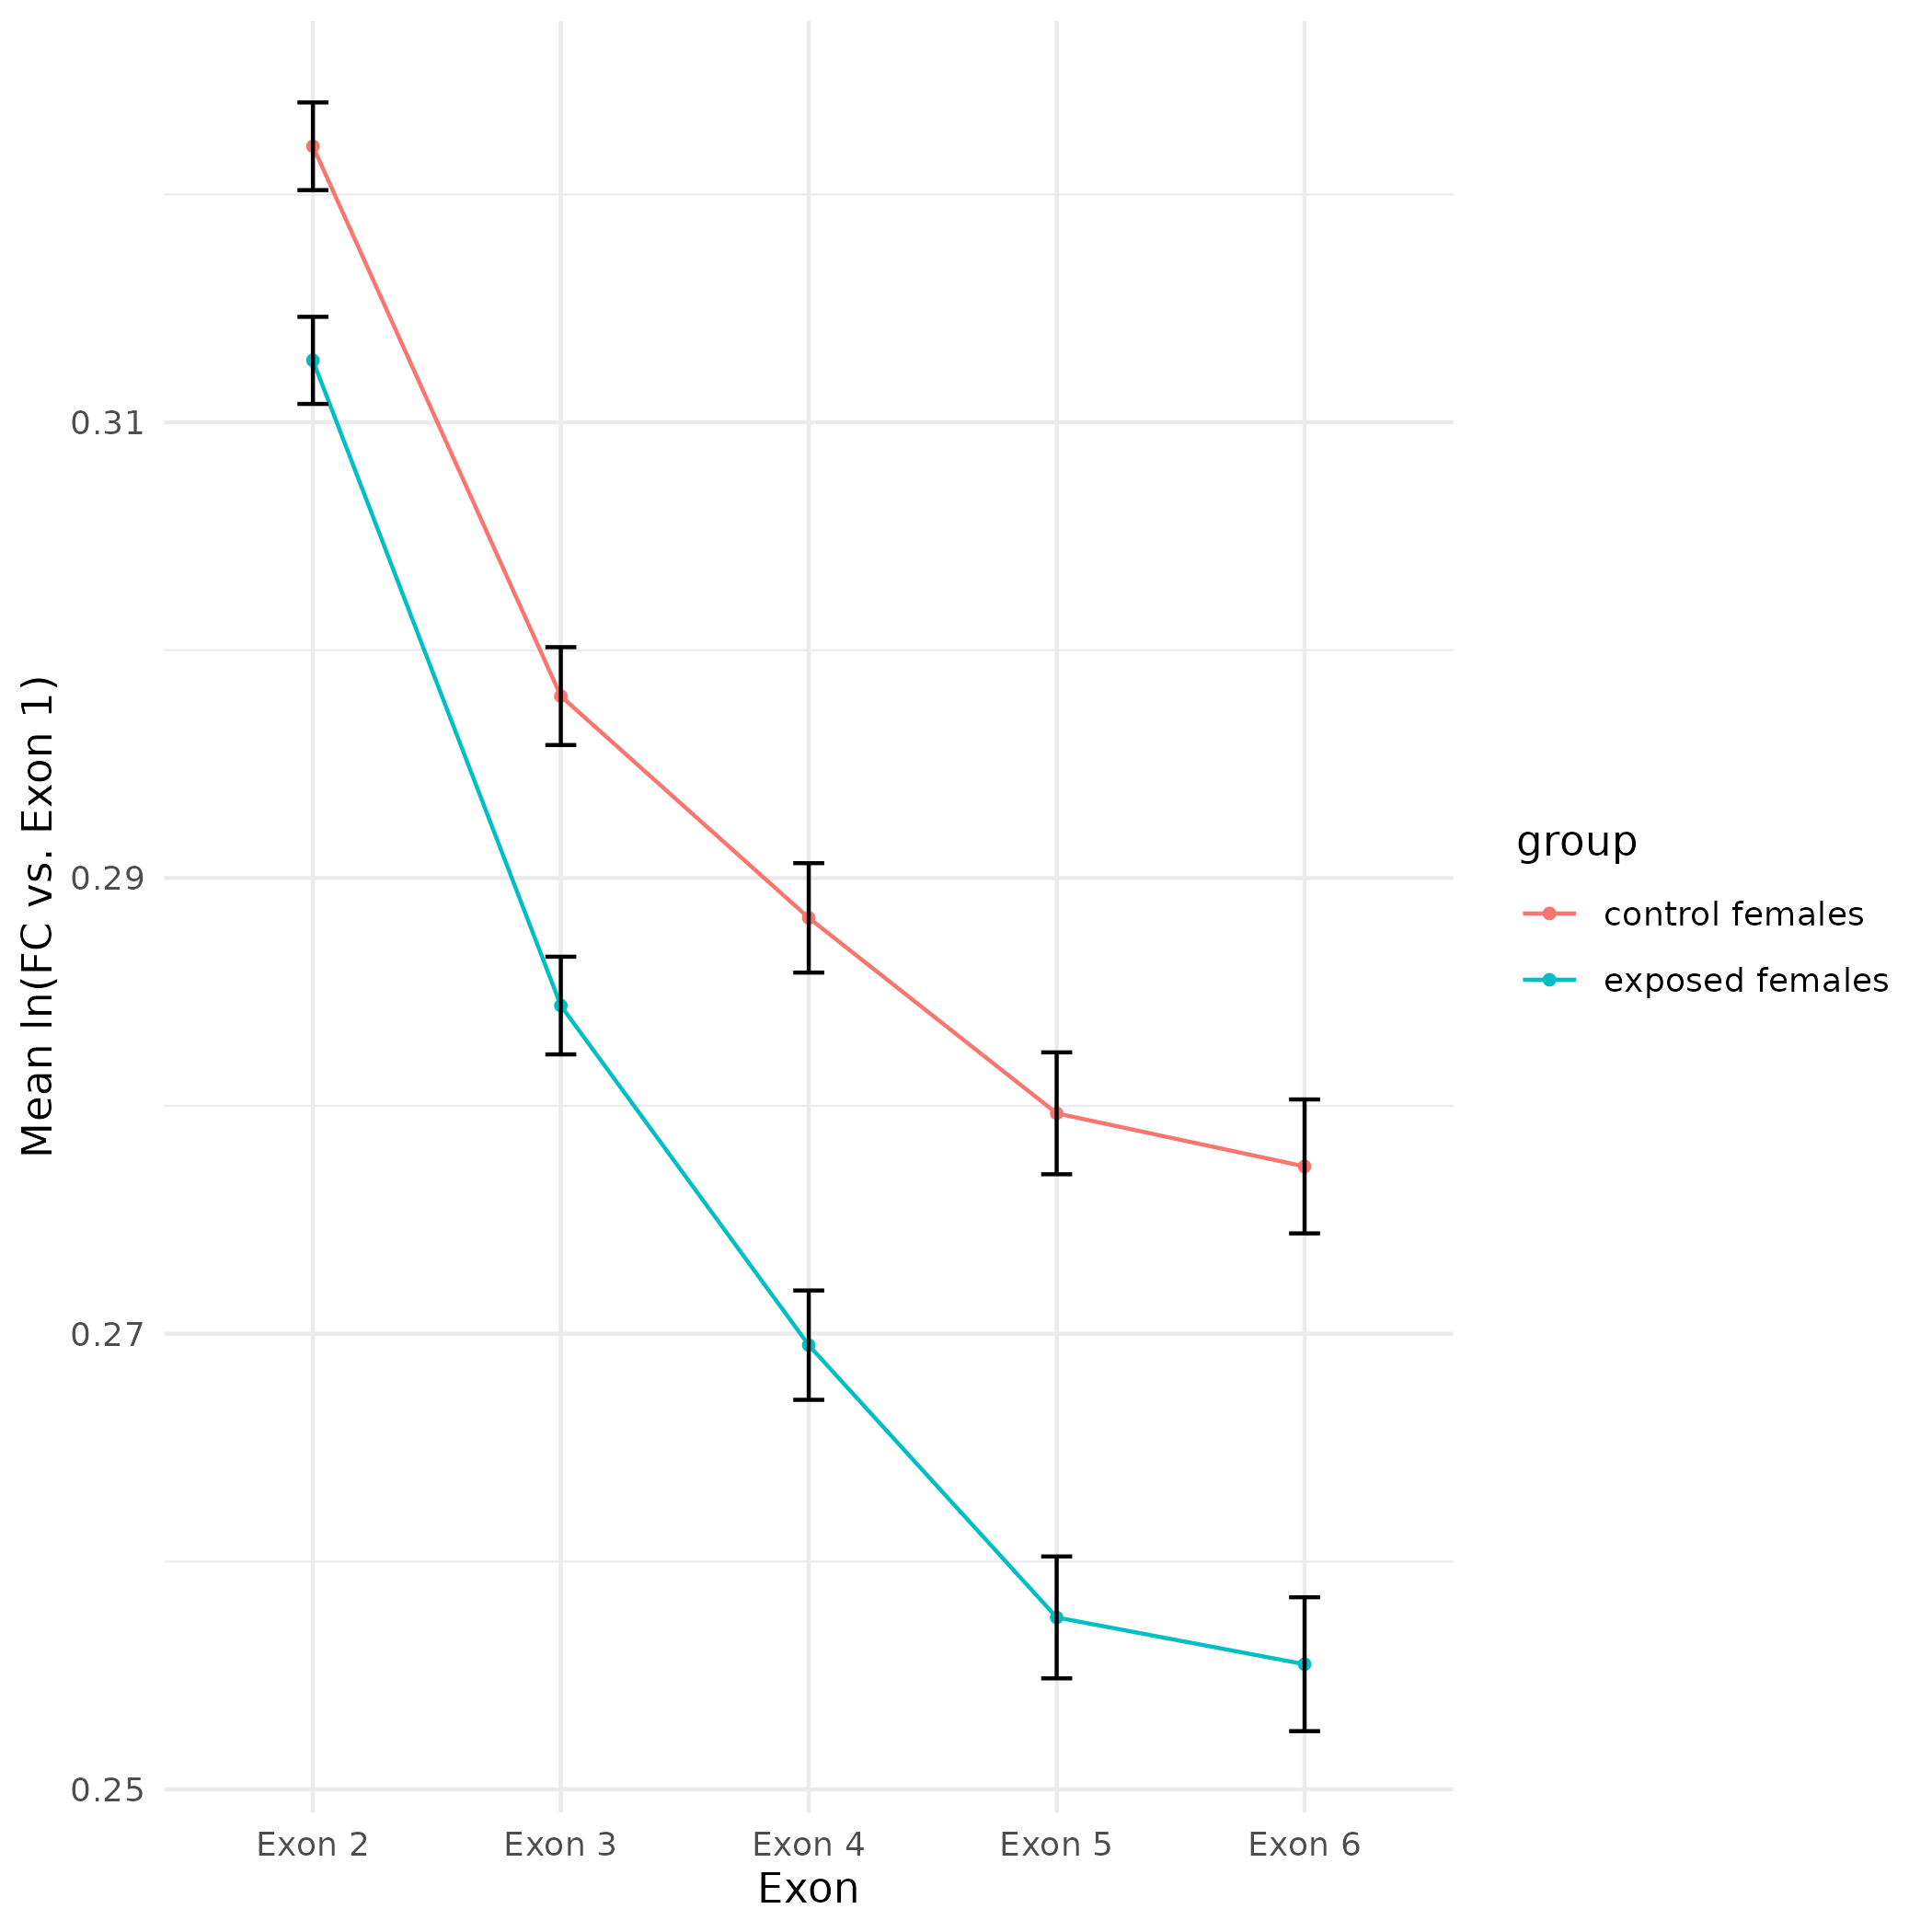
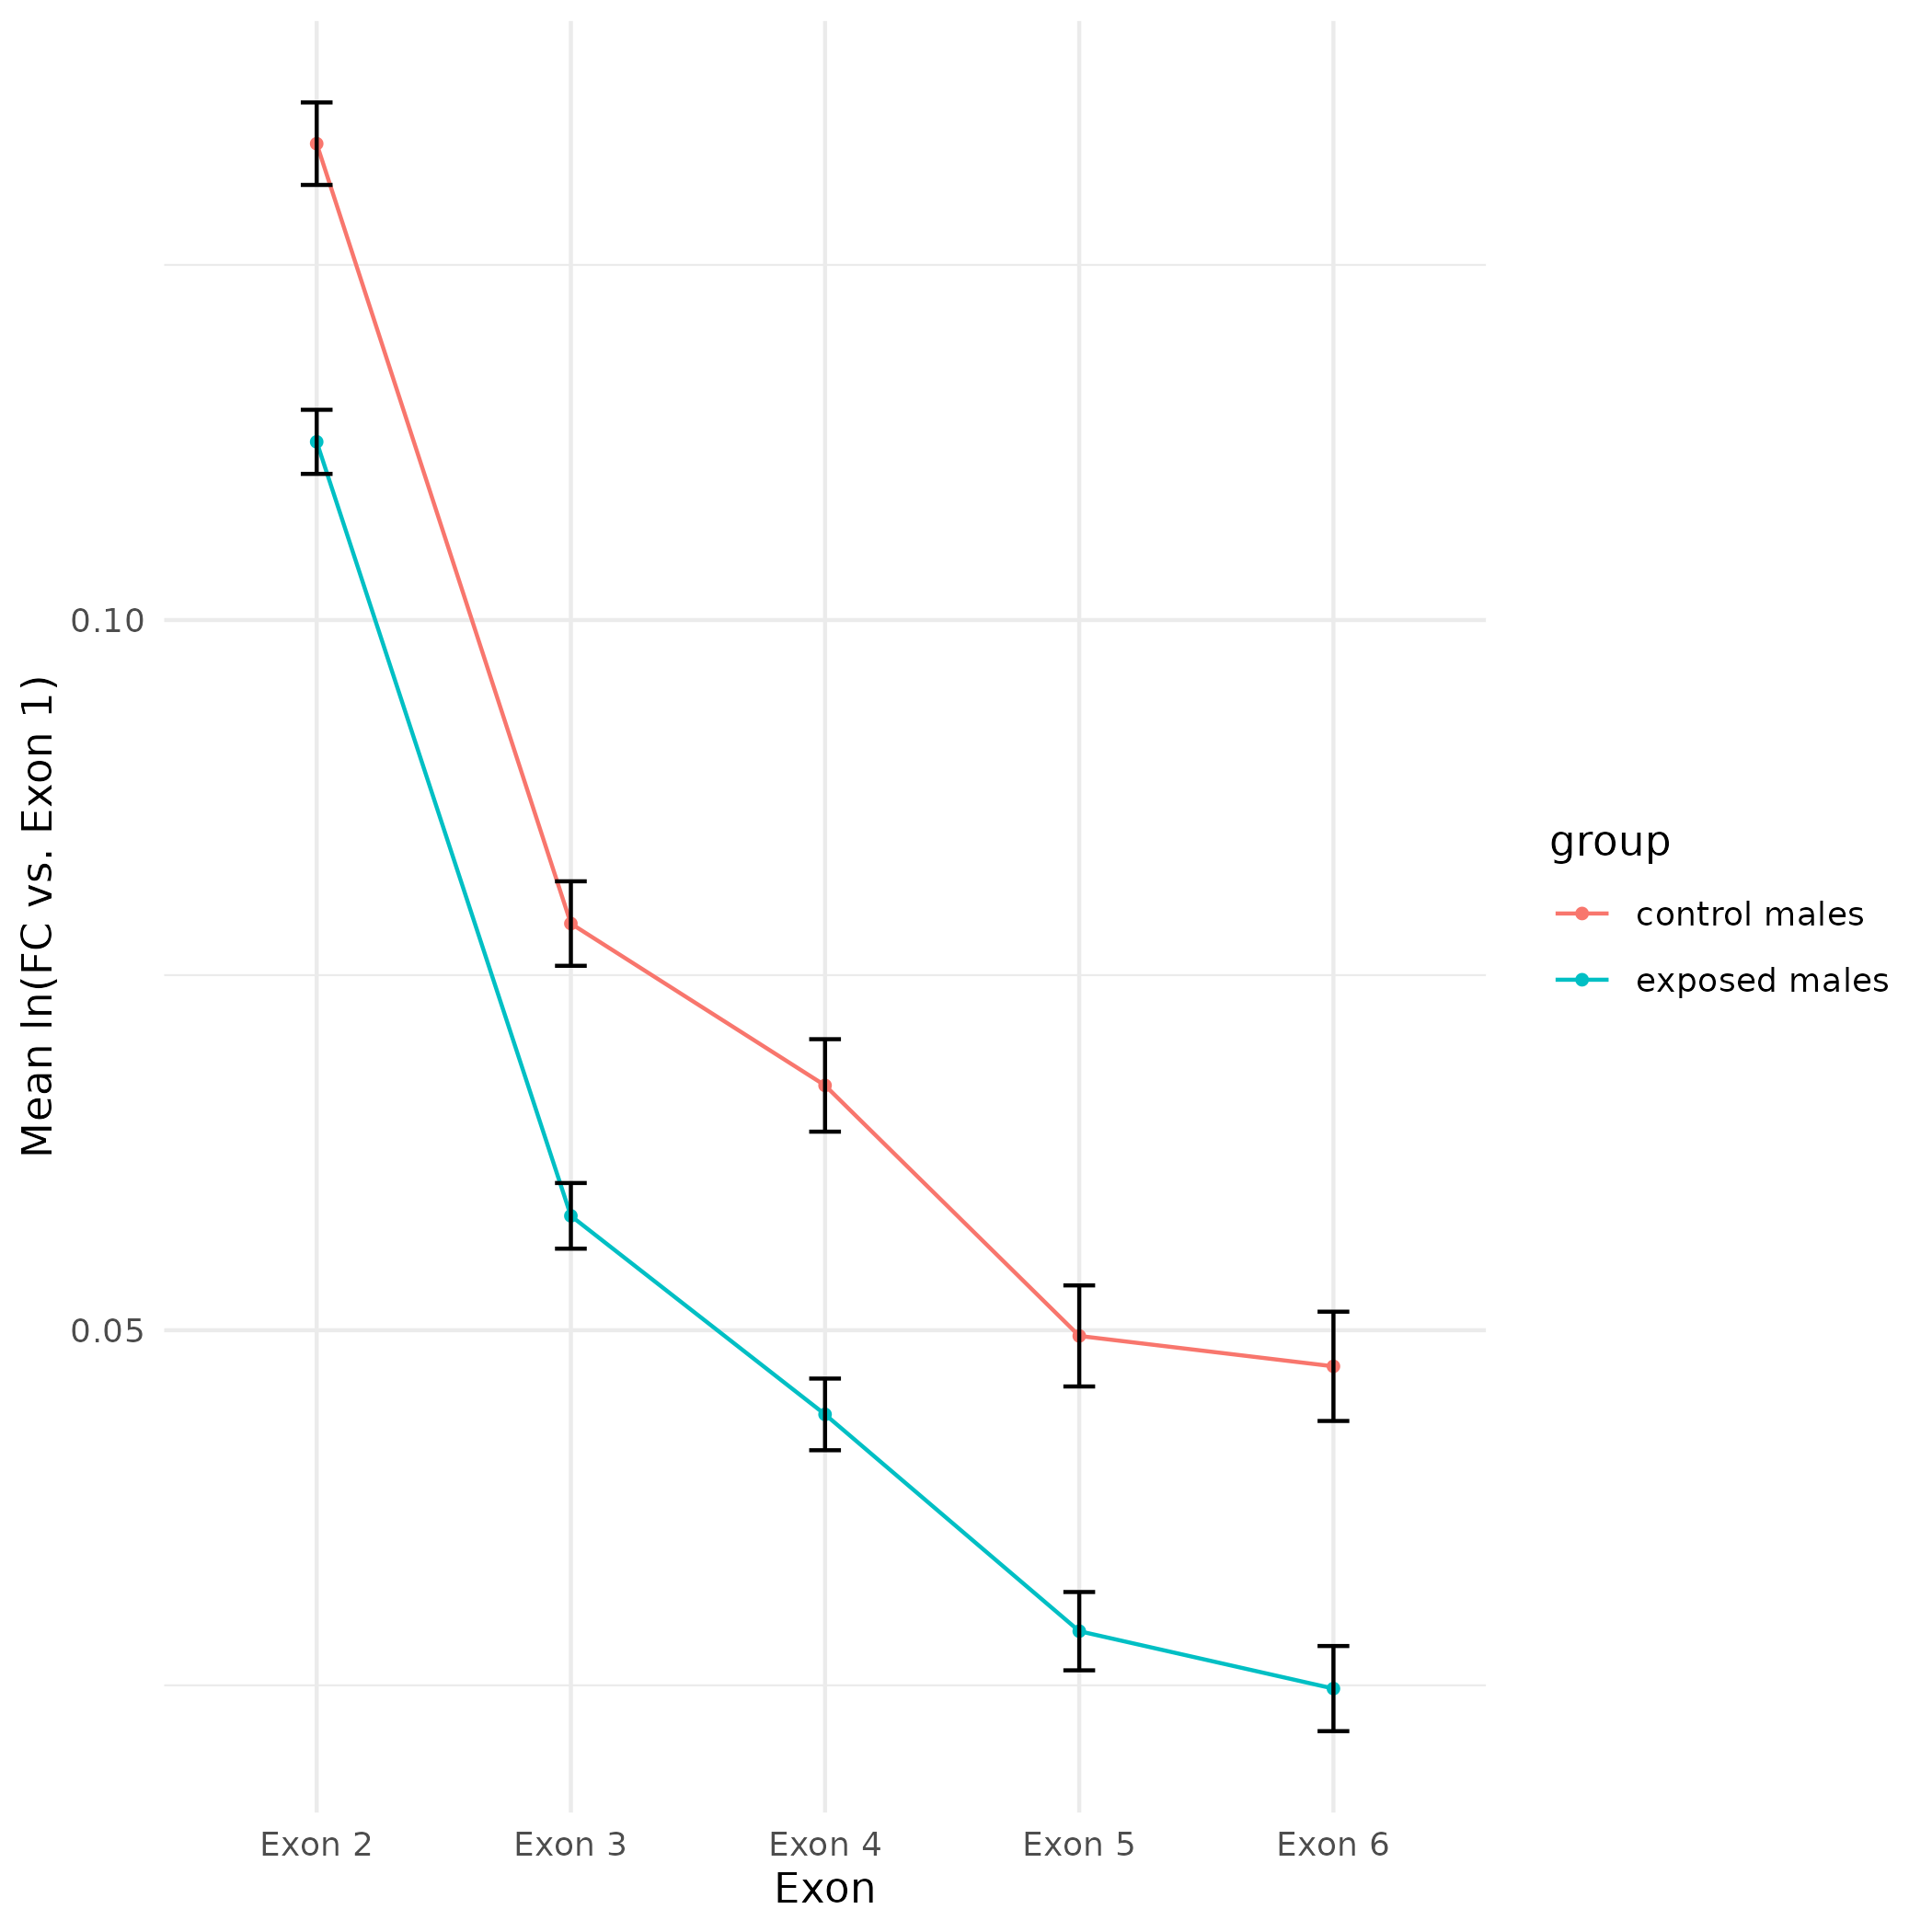
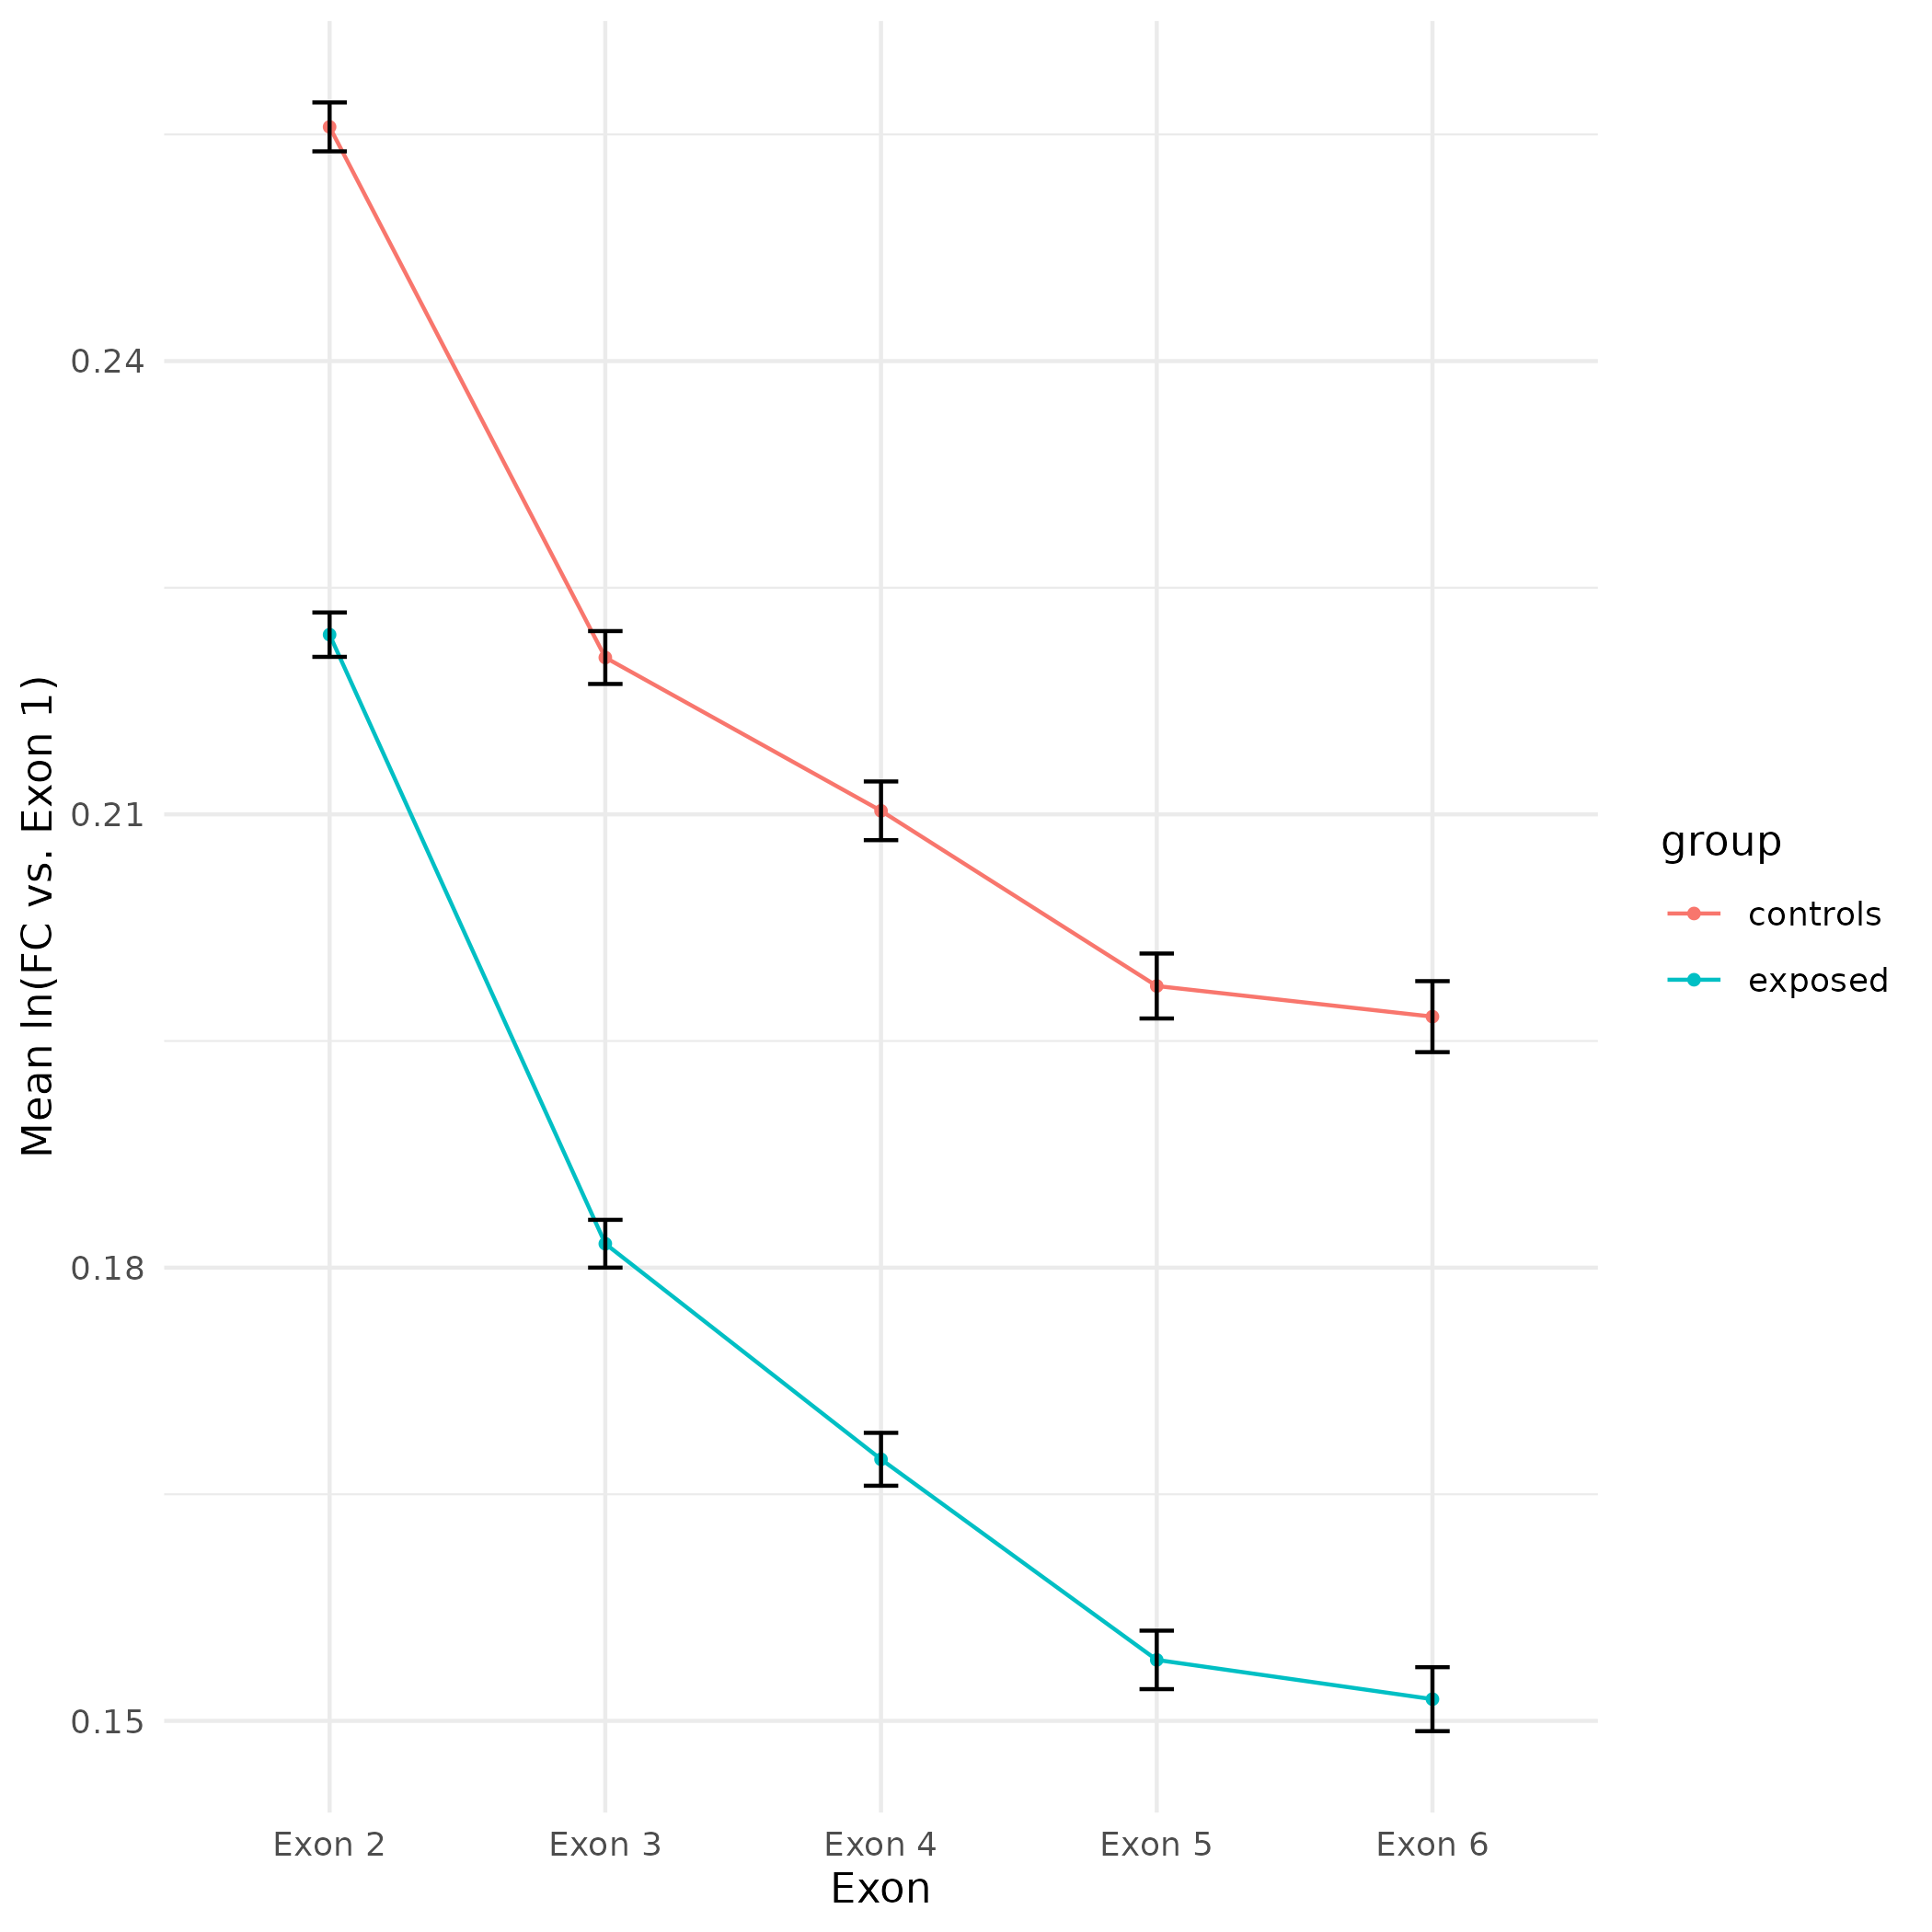
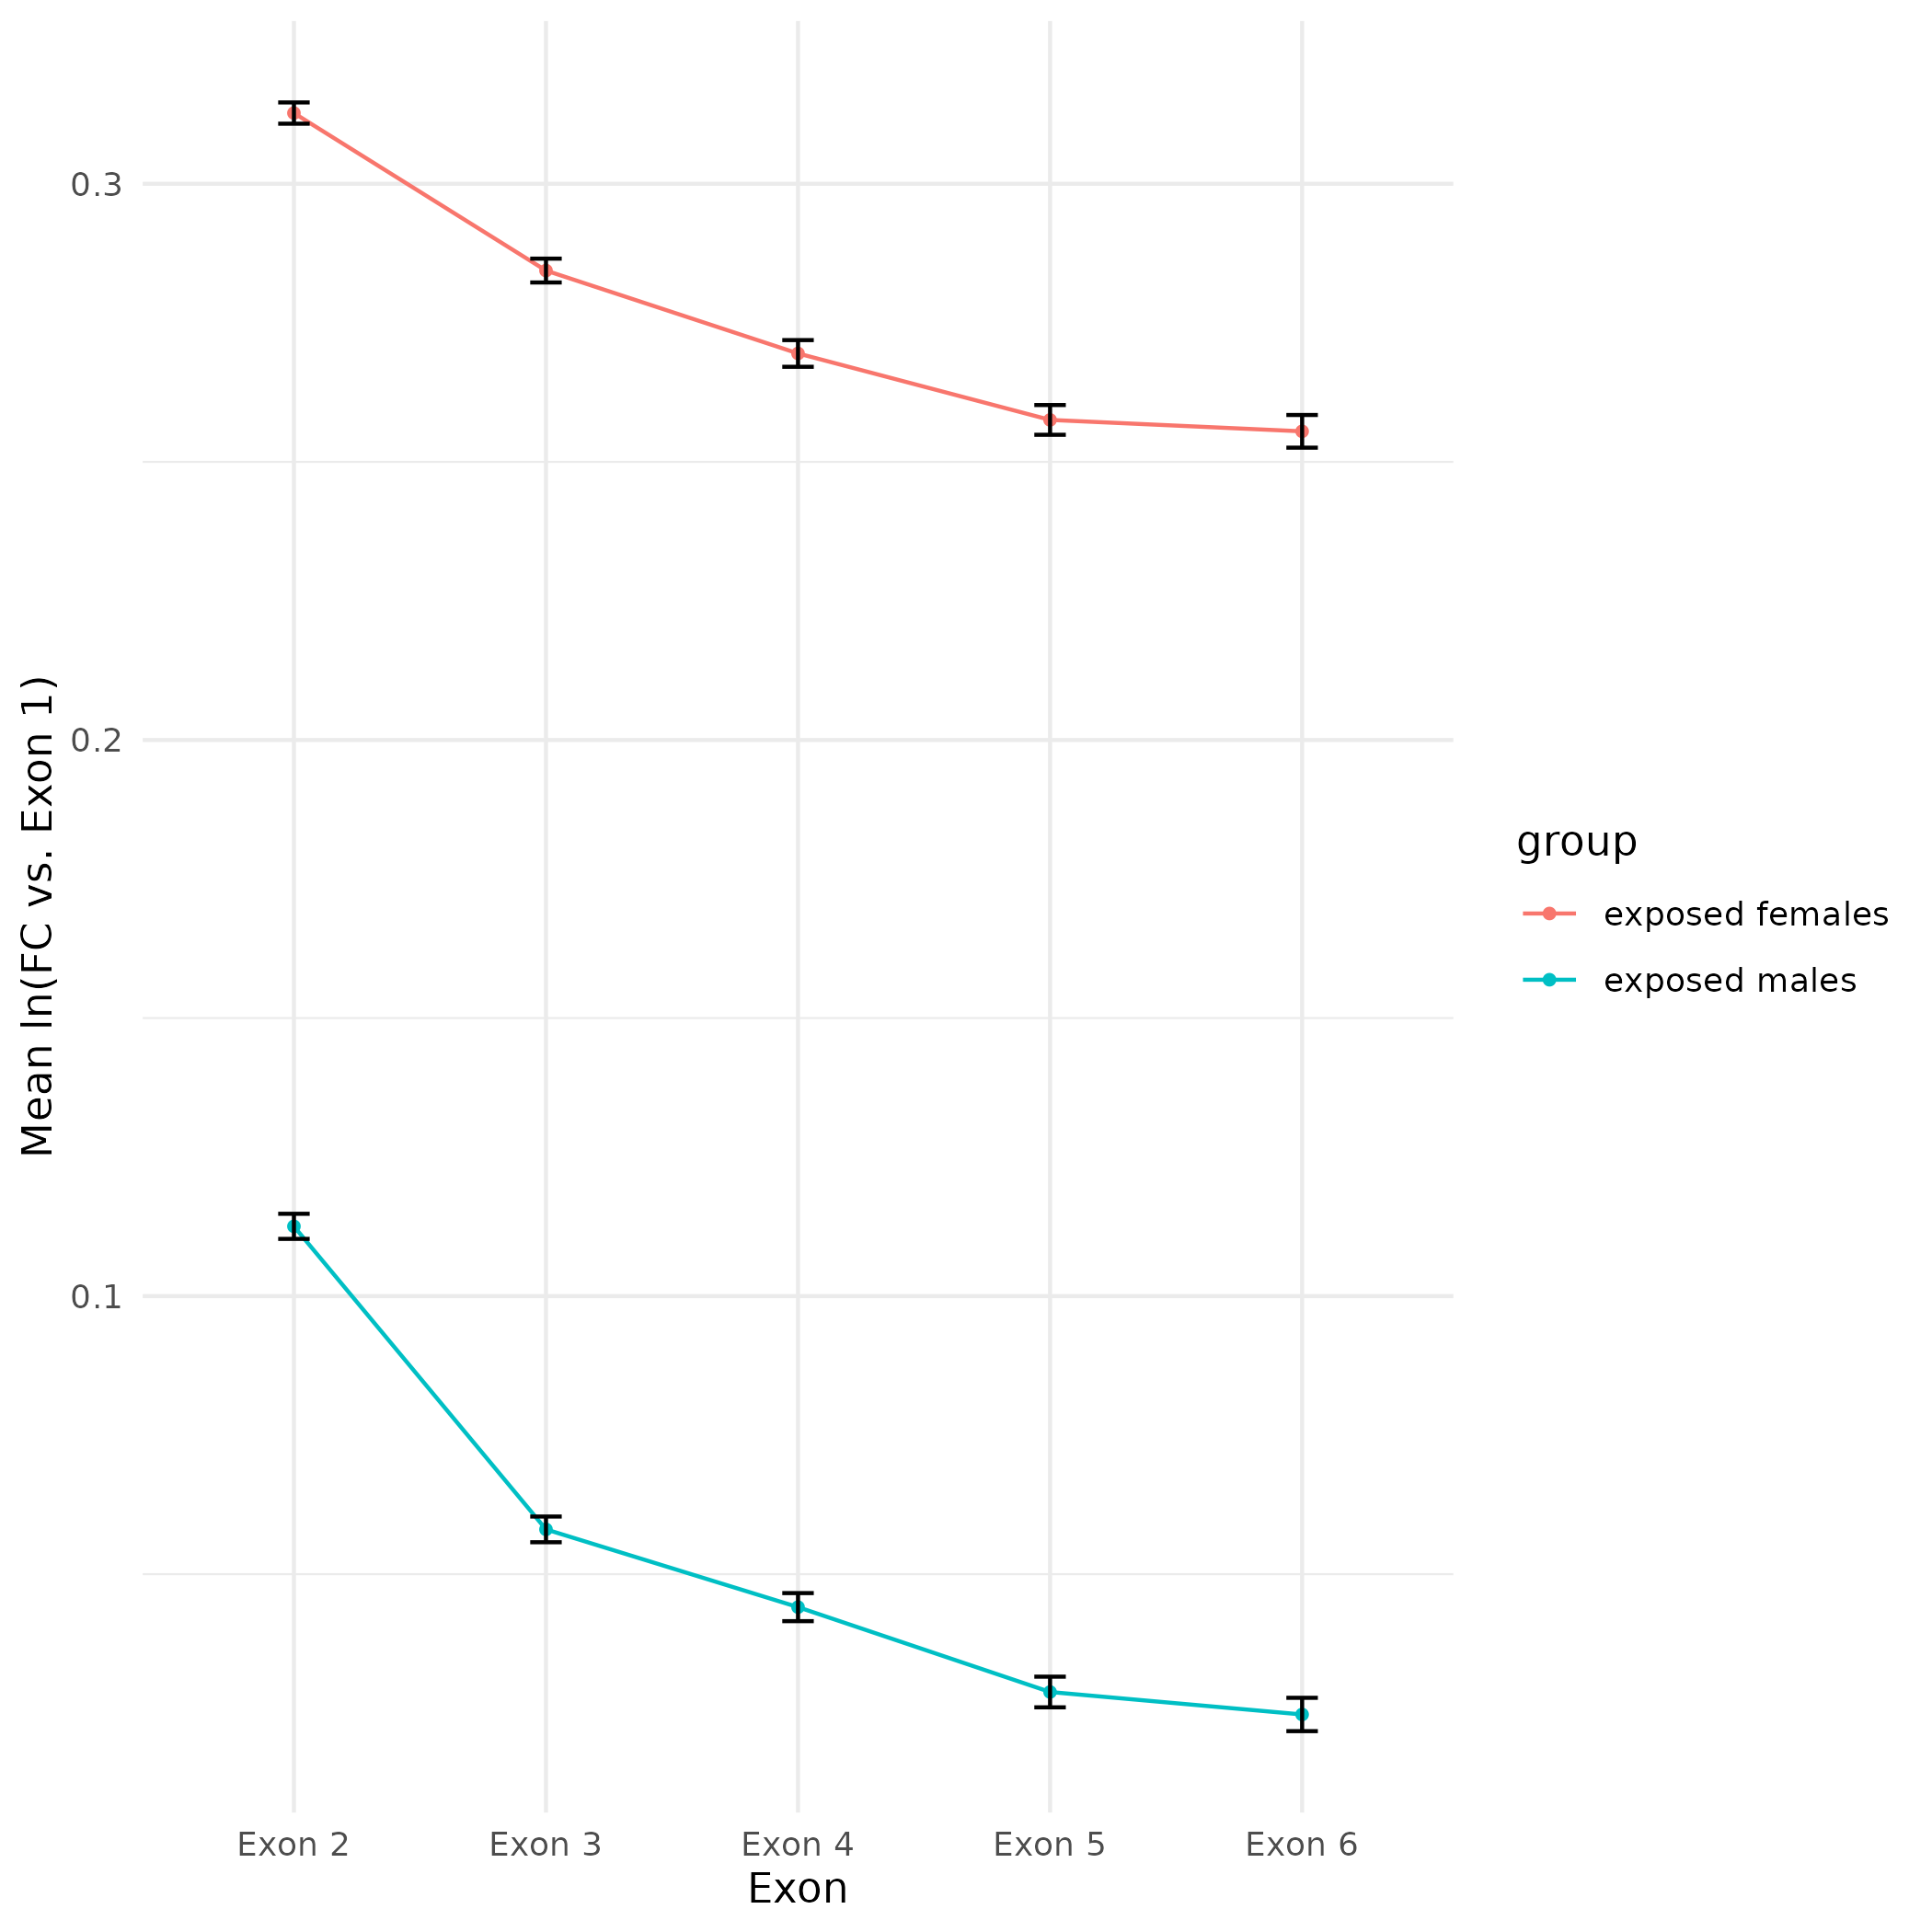
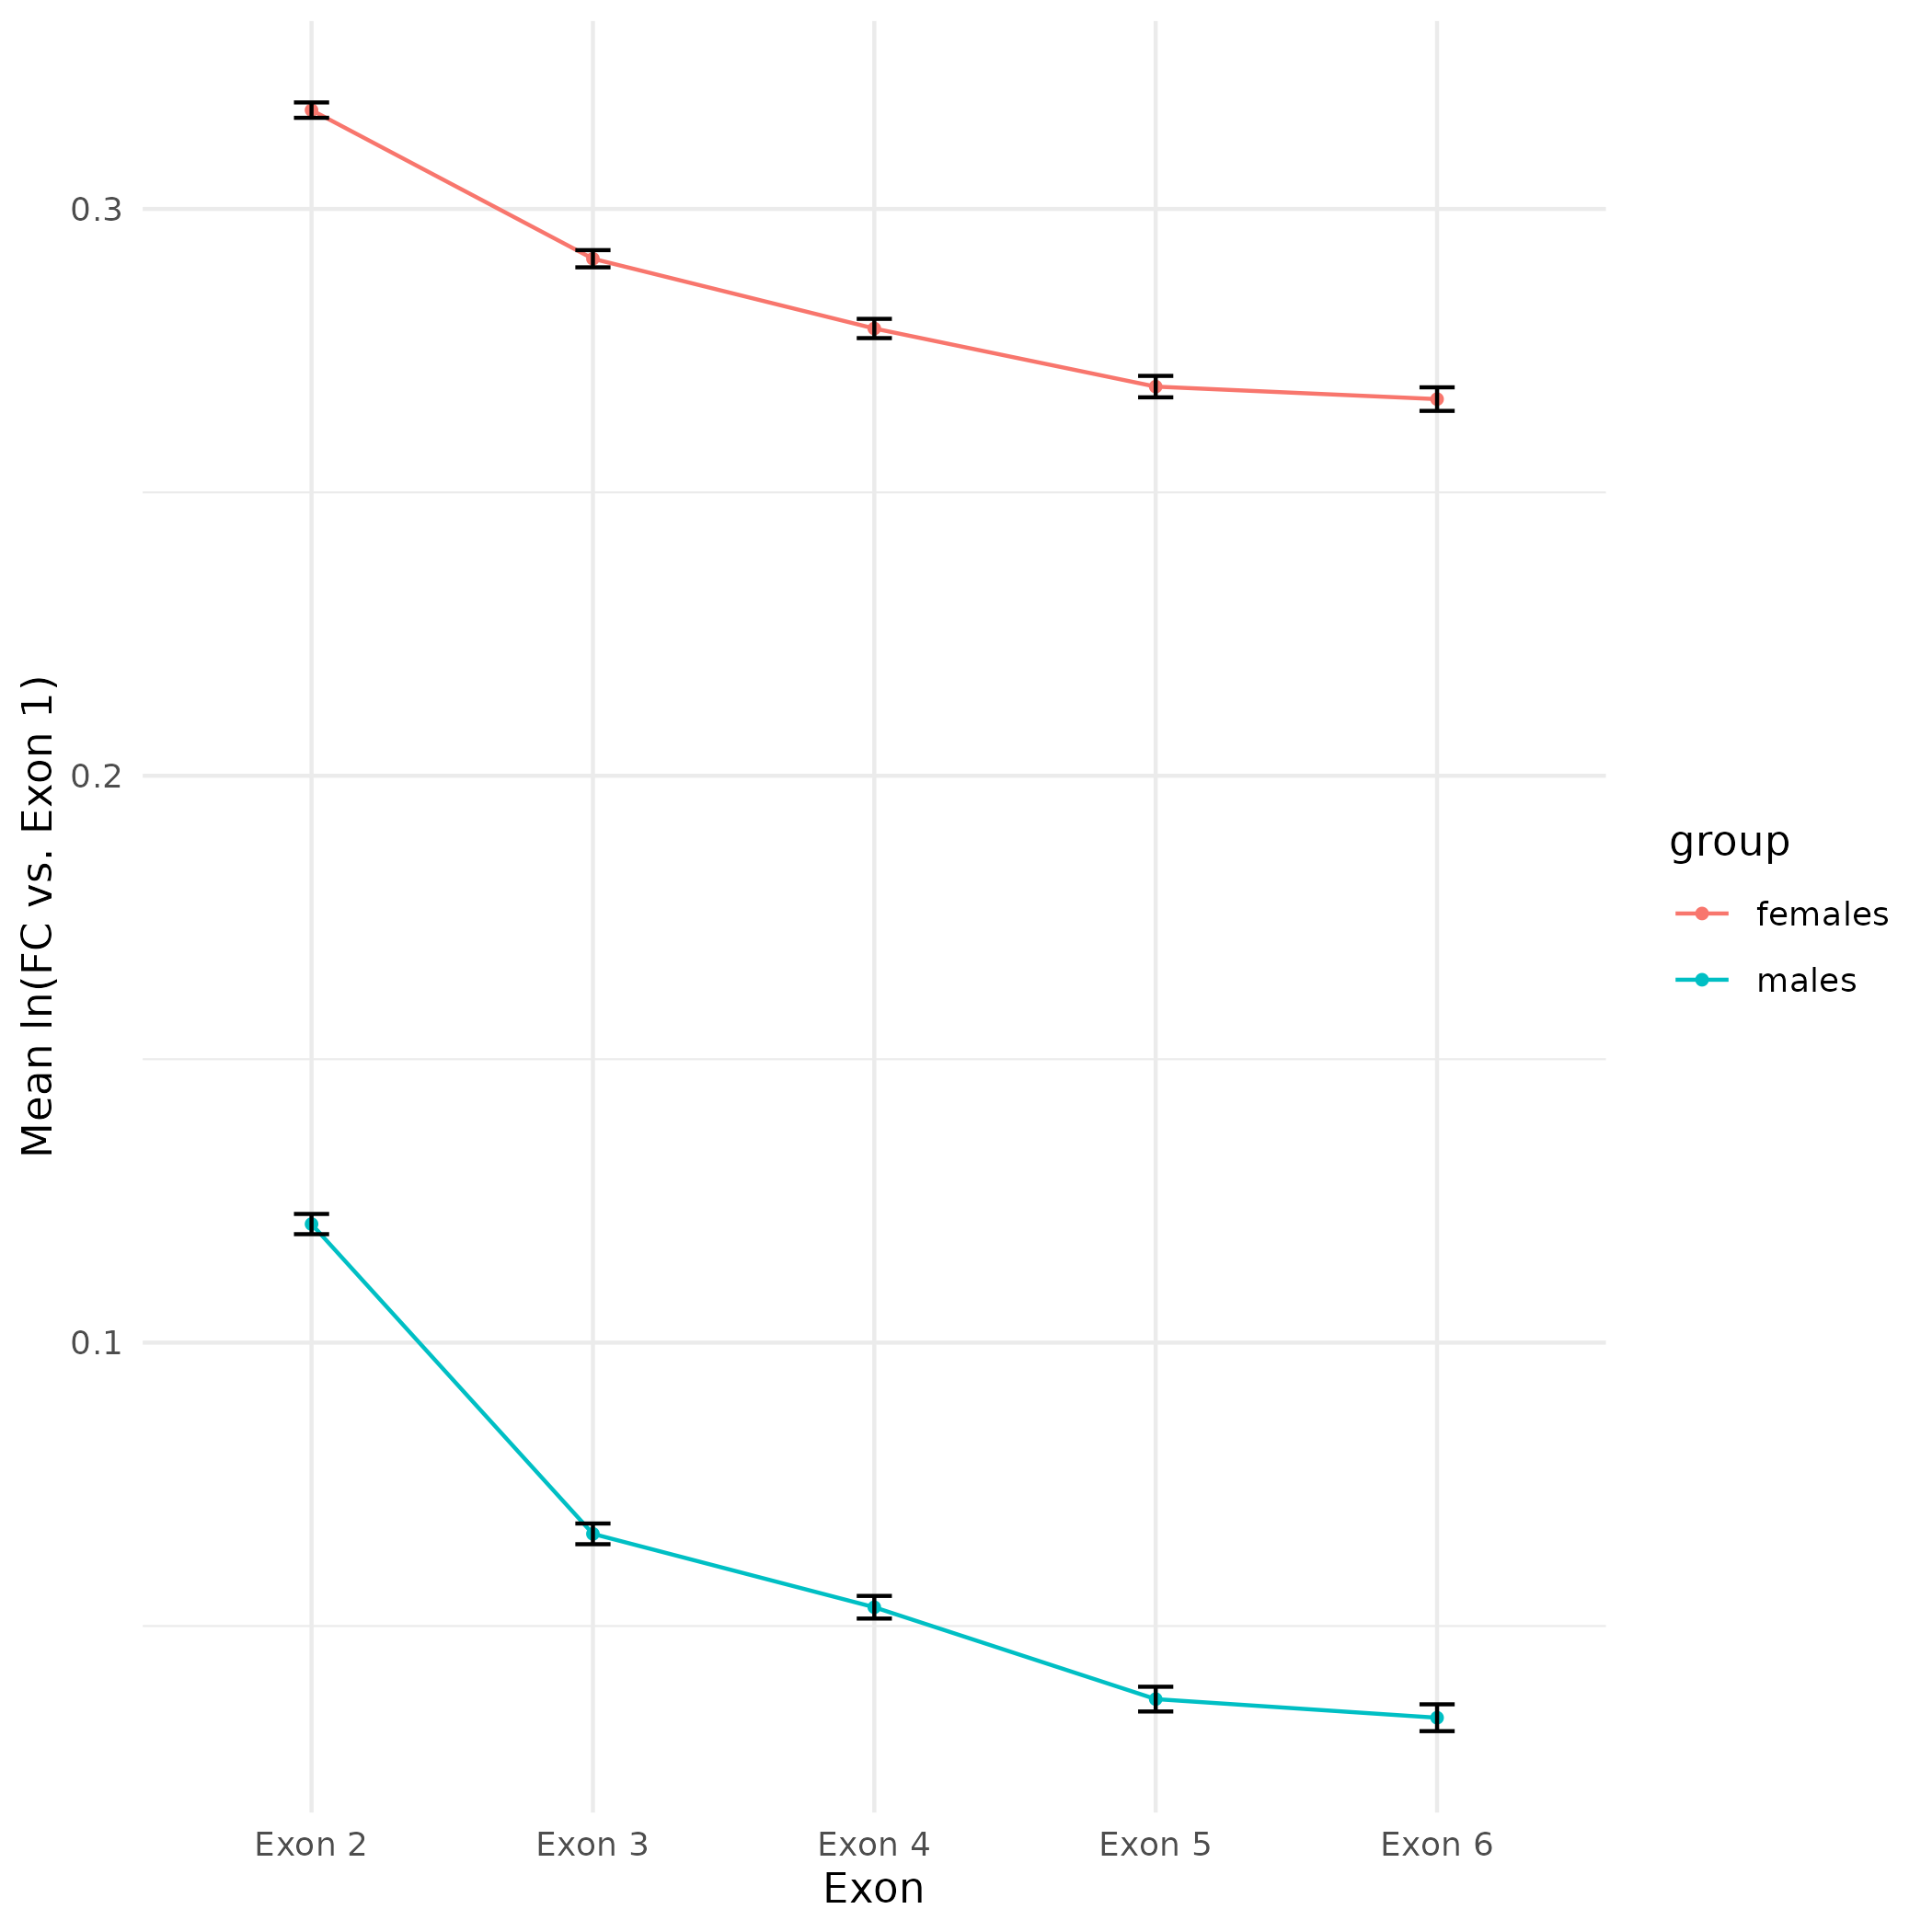
All plots are line plots of the mean natural log fold-change in exon expression (Exons 2-6), relative to Exon 1. Black bars represent standard error.
Plots are simply arranged side-by-side. Scales of axes are not intended to match.
