INTRO
Ran qPCRs on the cDNA I made last week (Notebook), as part of the project-gigas-carryover (GitHub Repo). This file provides metadata for the samples being qPCR’d:
- 20240314_rna_extractions.csv (GitHub; commit:
82f1a4b).
Not all of the samples listed in the sheet above were used in the qPCRs, due to lack of RNA during isolation (Notebook).
The following primer sets were selected, based on previous usage in other stress (heat) experiments:
| SR ID | Primer Name |
|---|---|
| 1385 | Cg_ATPsynthase_F |
| 1386 | Cg_ATPsynthase_R |
| 1383 | Cg_citratesynthase_F |
| 1384 | Cg_citratesynthase_R |
| 1172 | Cg_GAPDH_205_F |
| 1173 | Cg_GAPDH_355_R |
| 599 | Cg_HSP70_F |
| 598 | Cg_HSP70_R |
| 1532 | Cg_Hsp90_F |
| 1533 | Cg_Hsp90_R |
| 1829 | Cg_VIPERIN_F |
| 1828 | Cg_VIPERIN_R |
| 1827 | Cg_cGAS_F |
| 1826 | Cg_cGAS_R |
| 1510 | Cg_DNMT1_F |
| 1511 | Cg_DNMT1_R |
MATERIALS & METHODS
All samples were run in duplicate, on low-profile, white 96-well plates (USA Scientific) in a CFX Connect (BioRad) real-time thermalcycler. All reactions consisted of the following:
| Component | Stock Concentration | Volume (uL) |
|---|---|---|
| cDNA | NA | 1 |
| SsoAdvanced Universal SYBR Green Supermix (BioRad) | 2x | 10 |
| PF | 10uM | 0.5 |
| PR | 10uM | 0.5 |
| H2O | NA | 8 |
| TOTAL | 20 |
For cycling parameters, plate layouts, etc. see the RESULTS section below.
Baseline threshold analysis was set to “Target” (“Fluorophore” is the default) in the CFX Maestro (BioRad) software for each plate.
RESULTS
Summary
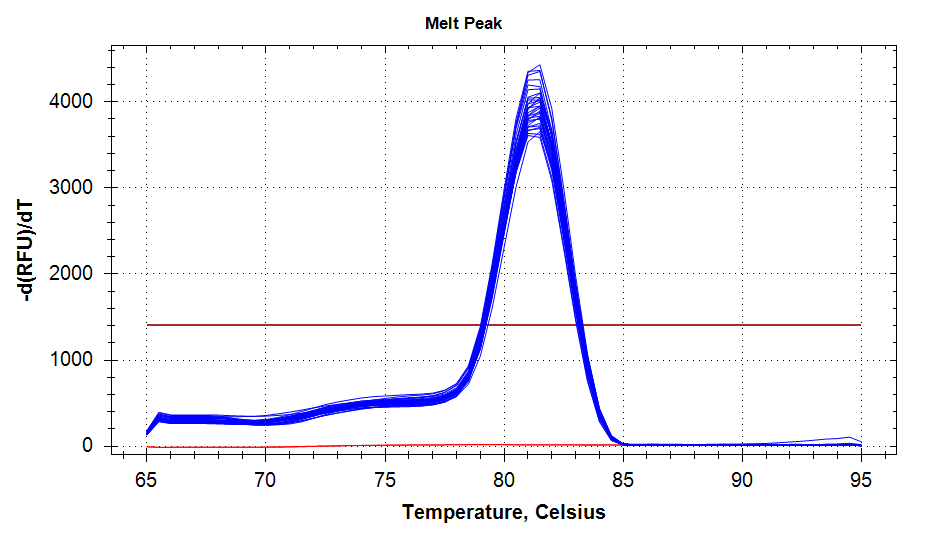
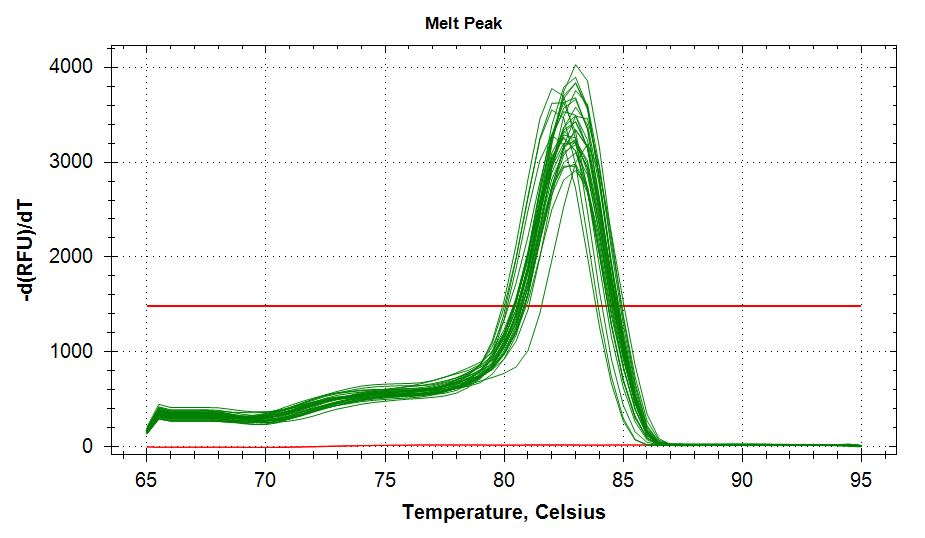
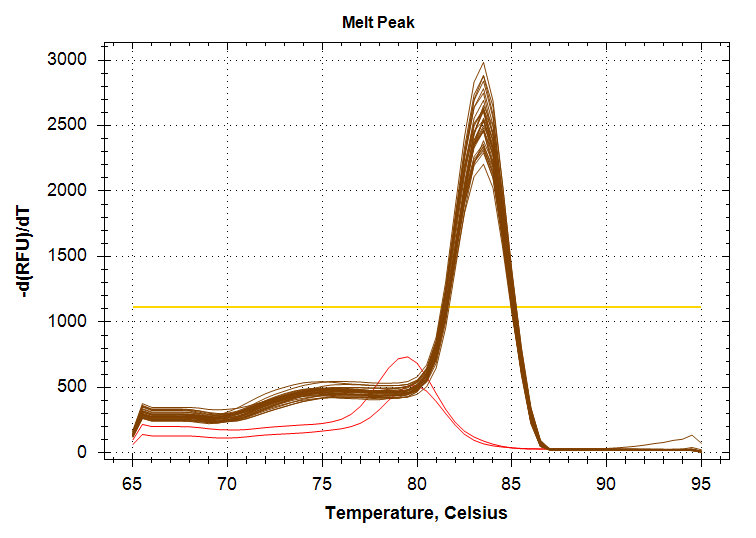
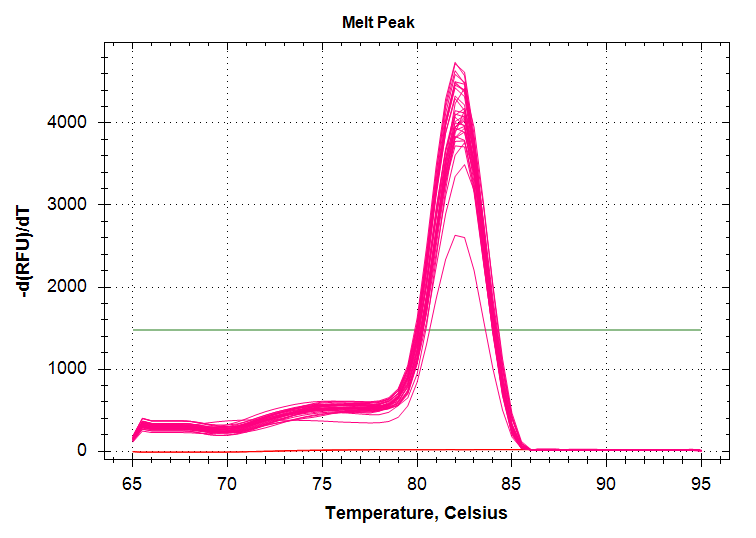
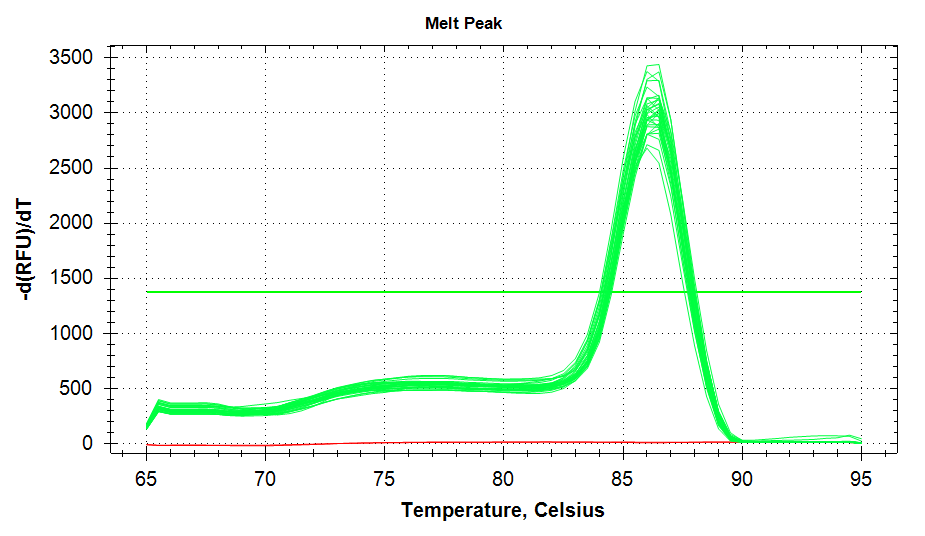
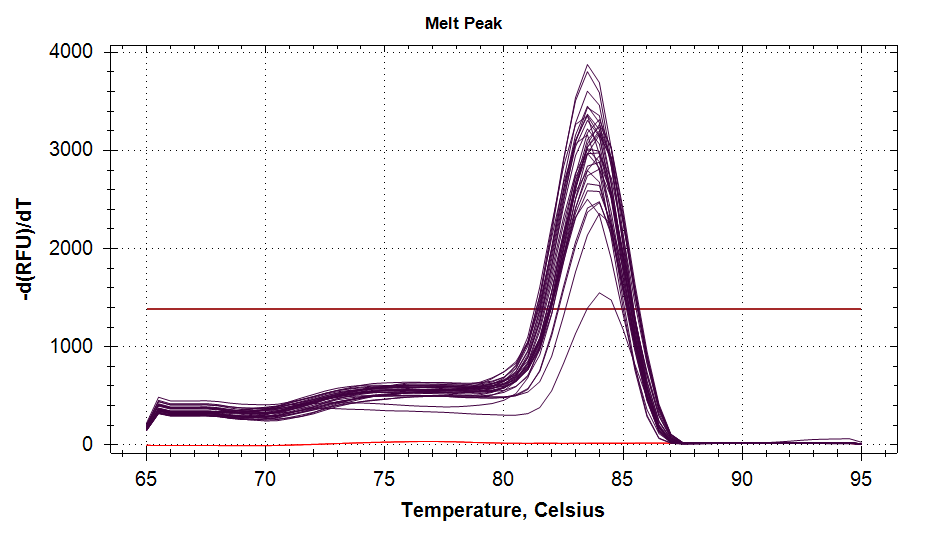
ATP Synthase: Amplification and melt plots look good. No amplification in NTCs. Reps are tight.HSP70: Amplification and melt plots look good. No amplification in NTCs. Sample244has a terrible set of reps (std. dev. of 4!!). All other reps are tight.GAPDH: Amplification and melt plots look good. Range of ~2.00 Cqs is decent and probably permits usage as normalizing gene for this experiment. Late amplification in NTCs, but melt temp peak is noticeably lower than other amplicons. As such, this is not concerning.cGAS: Amplification and melt plots look good. Late amplification in NTCs, but melt temp peak is ~2oC lower than other amplicons… Might be some non-specific amplification? Reps are tight. Reps are tight.HSP90: Amplification and melt plots look good. No amplification in NTCs. Sample223reps are poor, but remainder are tight.VIPERIN: Amplification and melt plots look good. Of note, amplification in243is noticeably later than all other samples. No amplification in NTCs. Most reps are tight, but samples223and243could be better…Citrate Synthase: Amplification and melt plots look good. Of note, amplification in243is noticeably later than all other samples. No amplification in NTCs. Reps are tight.DNMT1: Amplification and melt plots look good. No amplification in NTCs. Most reps are tight, but296,298,223,243, and285aren’t great…
Files
*.pdf: qPCR Reports. Contains plate layouts, cycling params, amp/melt plots, etc.*Amplificaiton_Results*.csv: Raw fluorescence data.*Cq_Results.csv: Cycle quantity (Cq) data.*.pcrd: Source qPCR data file. Requires CFX Maestro (BioRad) software to open.
ATP Synthase & HSP70
GAPDH & HSP90
cGAS & VIPERIN
Citrate Synthase & DNMT1
sam_2024-03-25_10-33-37_Connect-Quantification-Amplification_Results-citrate_synthase.csvsam_2024-03-25_10-33-37_Connect-Quantification-Amplification_Results-DNMT1.csvsam_2024-03-25_10-33-37_Connect-Quantification-Amplification_Results-citrate_synthase.csvsam_2024-03-25_10-33-37_Connect-Quantification-Cq_Results.csv
Plots - Amplification and Melt Plots
No Template Controls (NTCs) are denoted by red lines in all plots.
| SR ID | Primer Name | Amplification plots | Melt plots |
|---|---|---|---|
| 1385/6 | Cg_ATPsynthase | 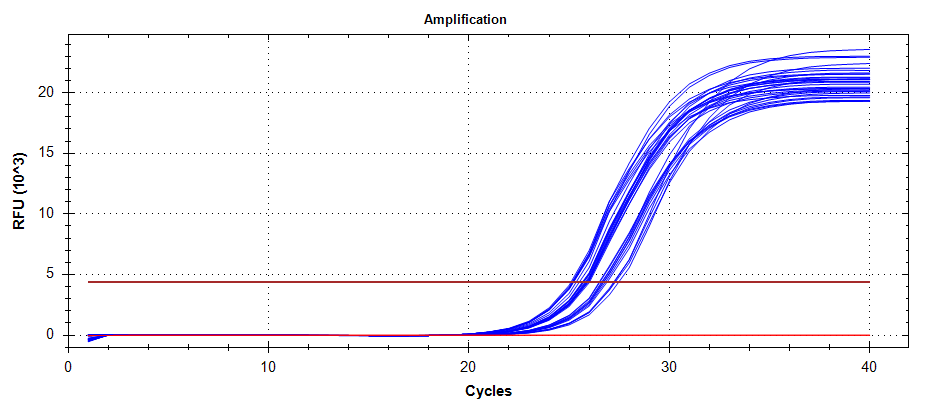 |
 |
| 1383/4 | Cg_HSP70 | 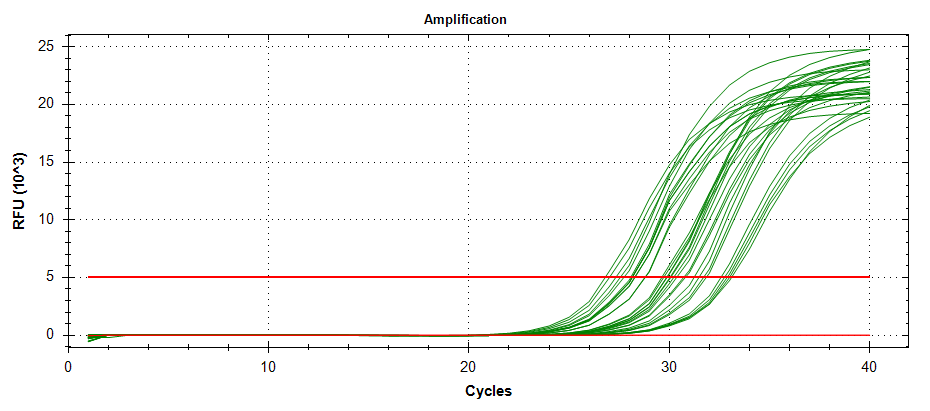 |
 |
| 1172/3 | Cg_GAPDH_205 | 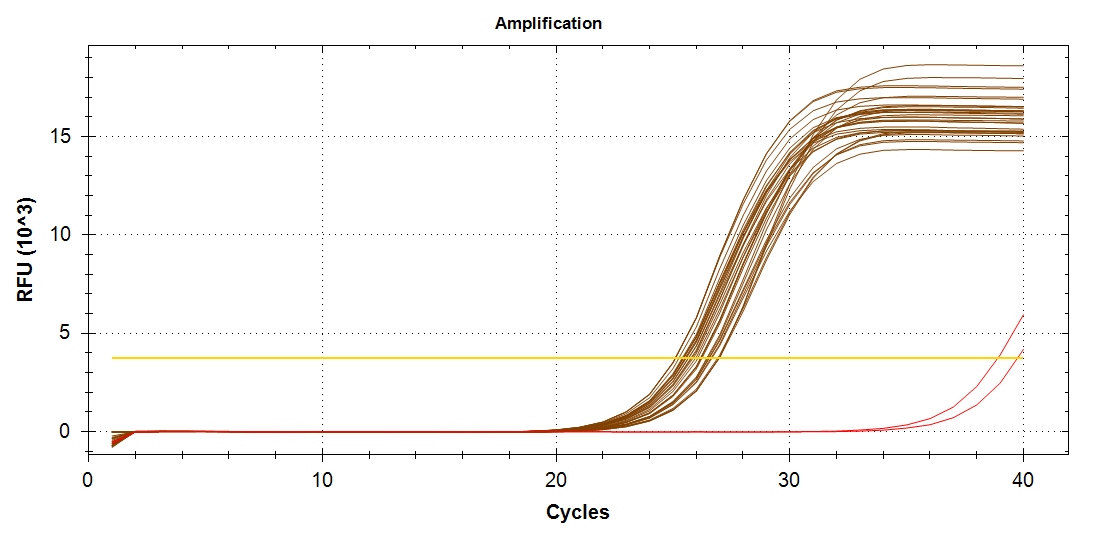 |
 |
| 598/9 | Cg_Hsp90 | 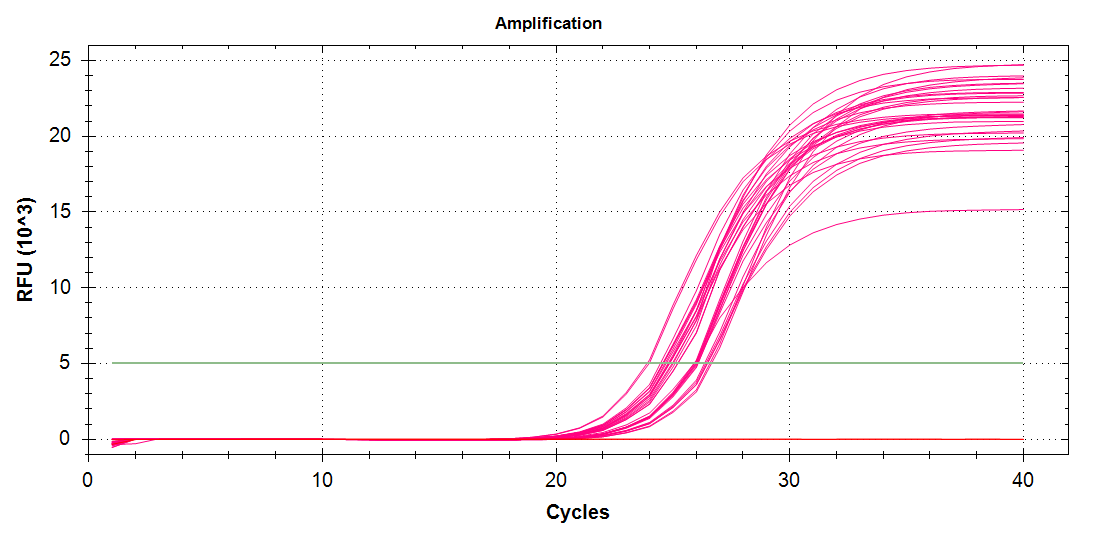 |
 |
| 1532/3 | Cg_cGAS | 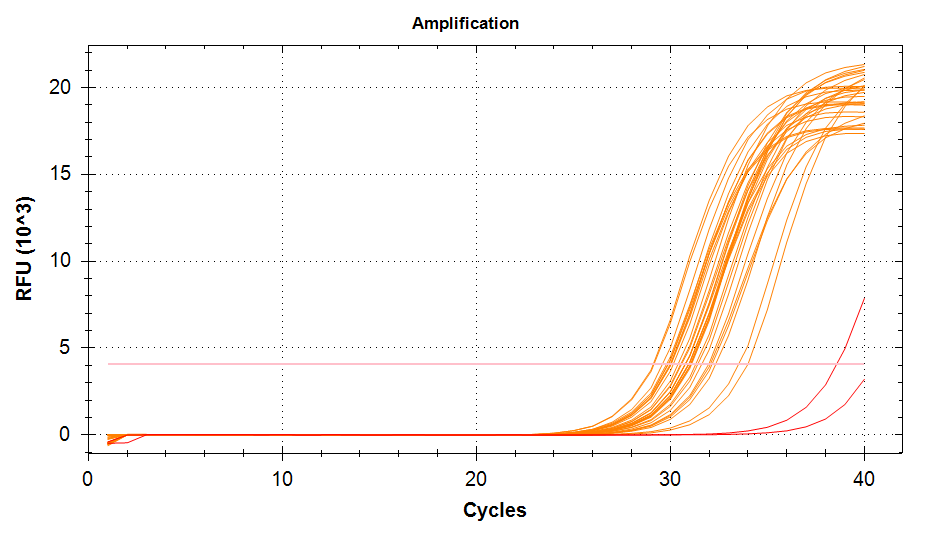 |
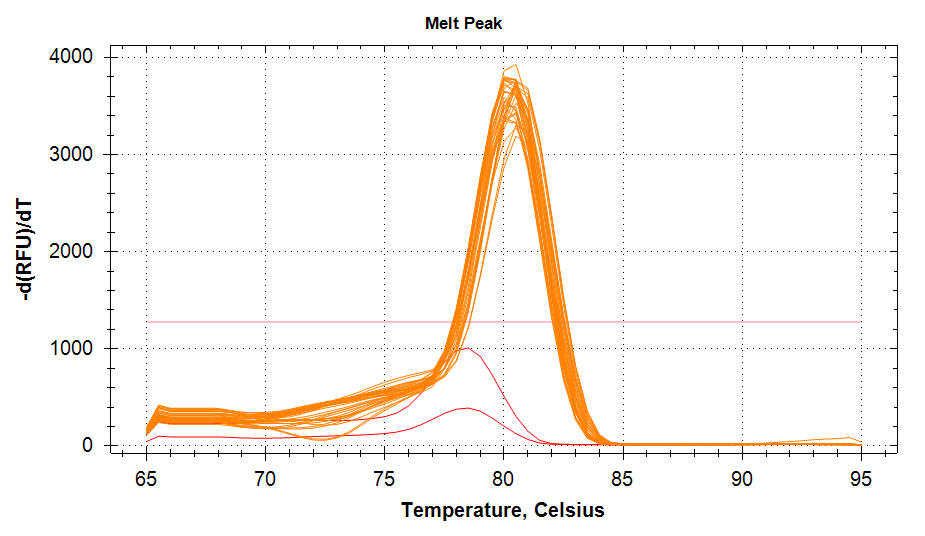 |
| 1828/9 | Cg_VIPERIN | 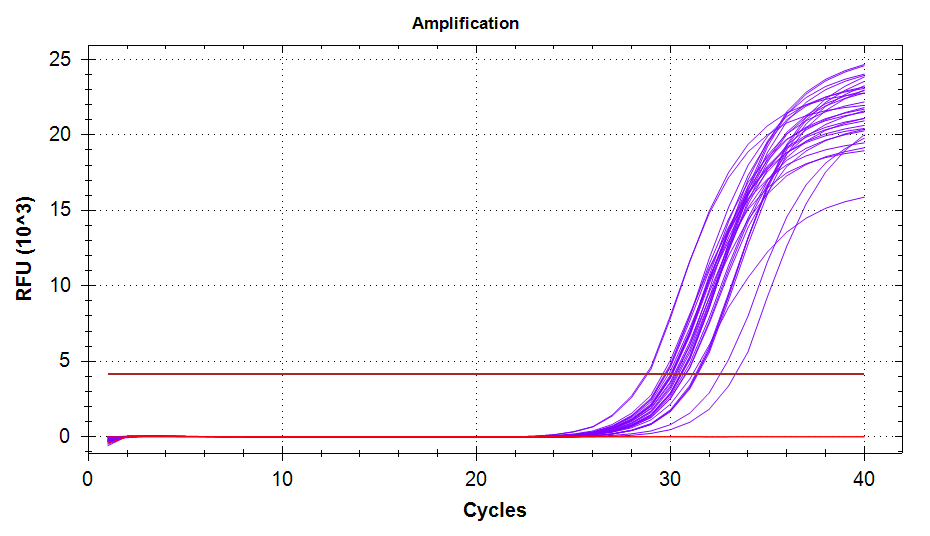 |
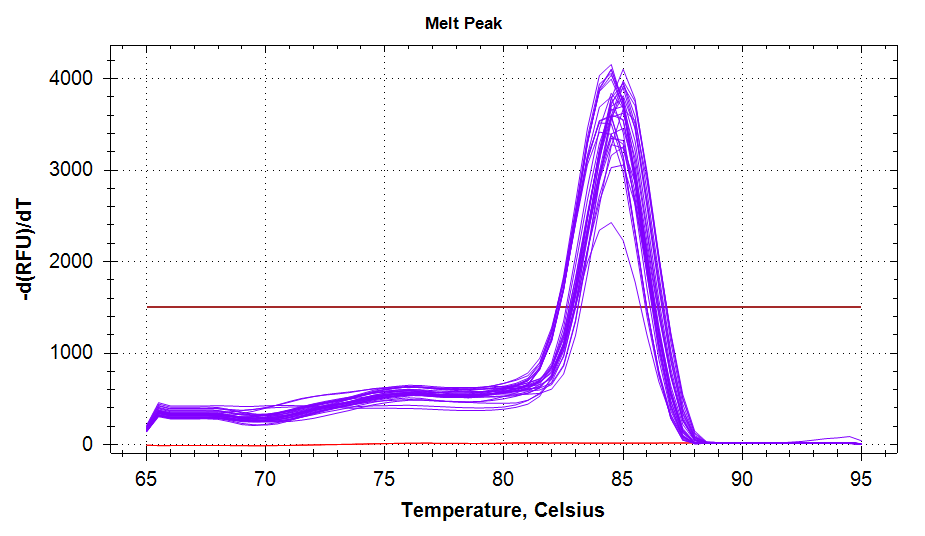 |
| 1824/5 | Cg_citratesynthase | 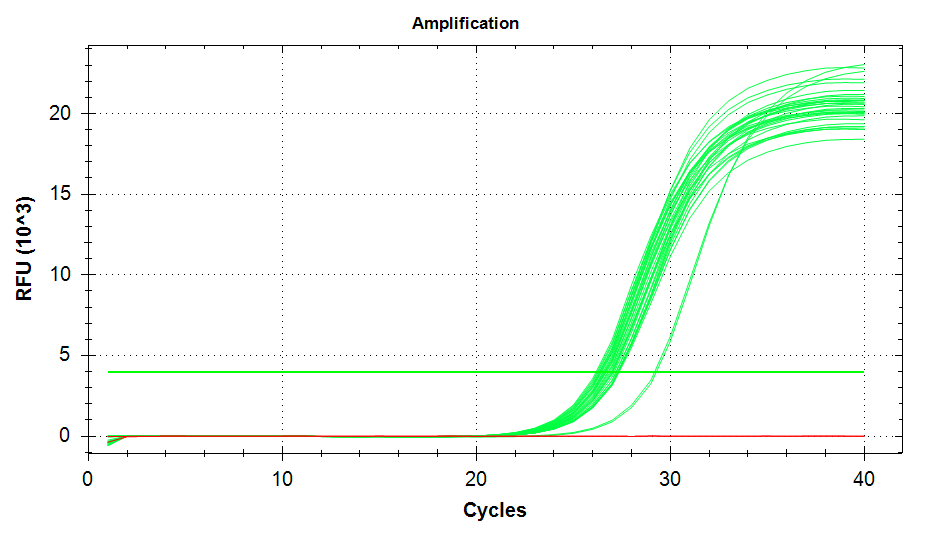 |
 |
| 1510/1 | Cg_DNMT1 | 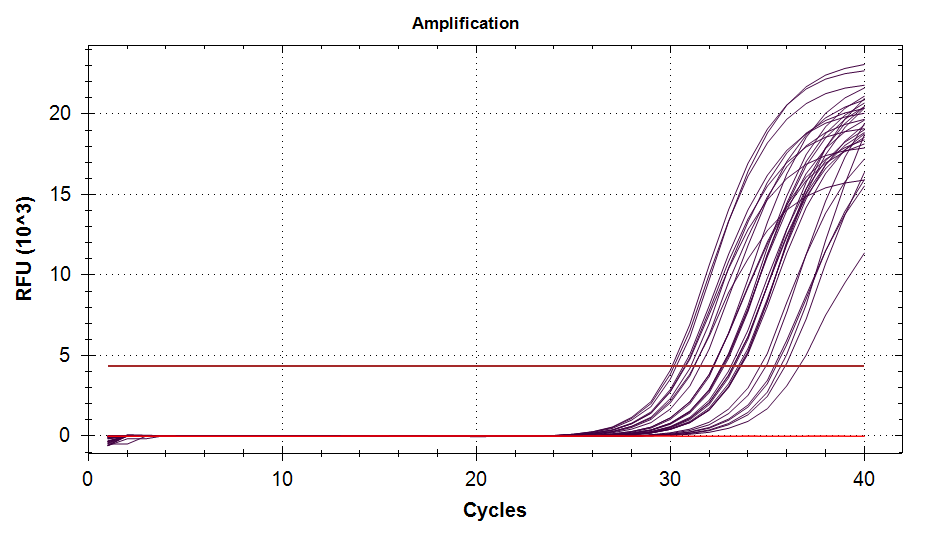 |
 |