INTRO
Continuing work with project-gigas-carryover lifestage_carryover (GitHub repo) after creating cDNA on 20250516, it was finally time to run the qPCRs.
This notebook describes how the qPCRs were run and links to the various output files. It also provides a brief overview of each primer set’s amplification profiles. This notebook does not have any analysis. This will be performed later.
MATERIALS & METHODS
Based on results from an initial round of qPCRs on 20240327 (Notebook entry), the following primer sets were run:
| SR ID | Primer Name |
|---|---|
| 1385 | Cg_ATPsynthase_F |
| 1386 | Cg_ATPsynthase_R |
| 1383 | Cg_citratesynthase_F |
| 1384 | Cg_citratesynthase_R |
| 1829 | Cg_VIPERIN_F |
| 1828 | Cg_VIPERIN_R |
| 1827 | Cg_cGAS_F |
| 1826 | Cg_cGAS_R |
All samples were run in triplicate, on low-profile, white 96-well plates (USA Scientific) in a CFX Connect (Bio-Rad) or CFX96 (Bio-Rad) real-time thermalcycler. All reactions consisted of the following:
| Component | Stock Concentration | Volume (uL) |
|---|---|---|
| cDNA | NA | 1 |
| SsoAdvanced Universal SYBR Green Supermix (BioRad) | 2x | 10 |
| PF | 10uM | 0.5 |
| PR | 10uM | 0.5 |
| H2O | NA | 8 |
| TOTAL | 20 |
Master mixes were distributed across one plate for each primer set and included no template controls (NTCs).
For cycling parameters, plate layouts, etc. see the RESULTS section below.
RESULTS
Summary
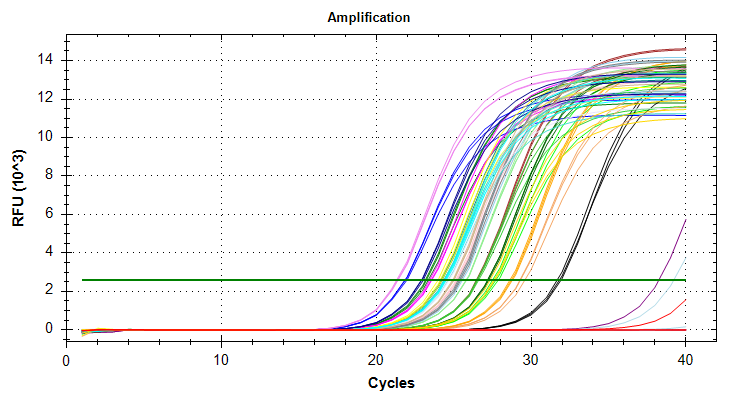
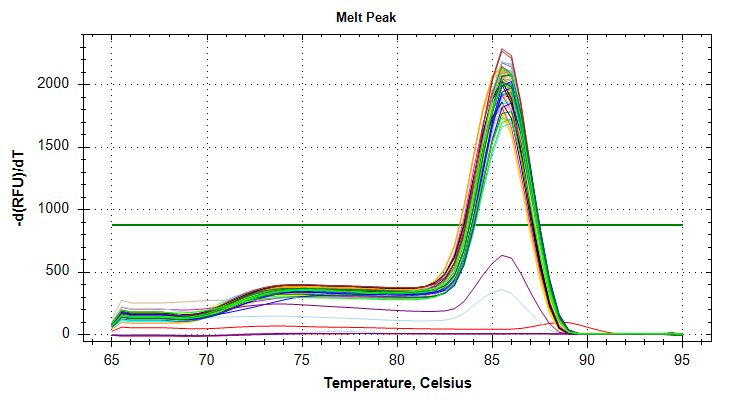
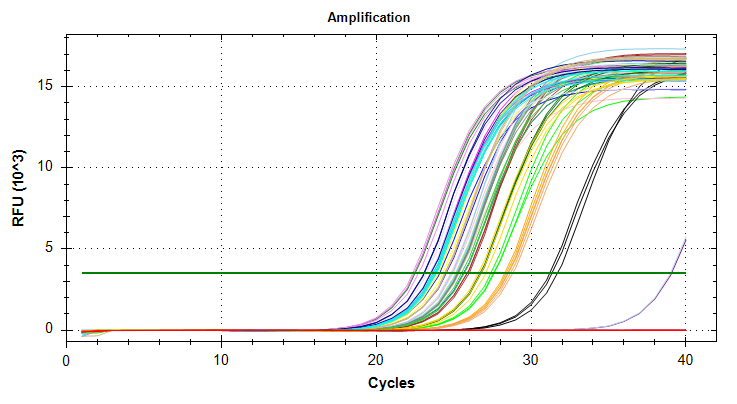
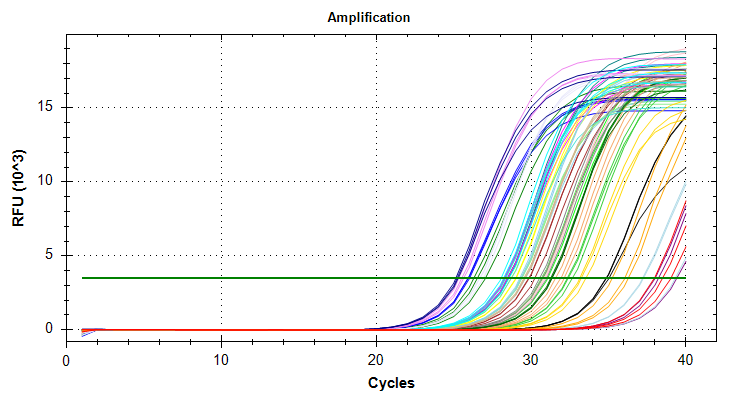
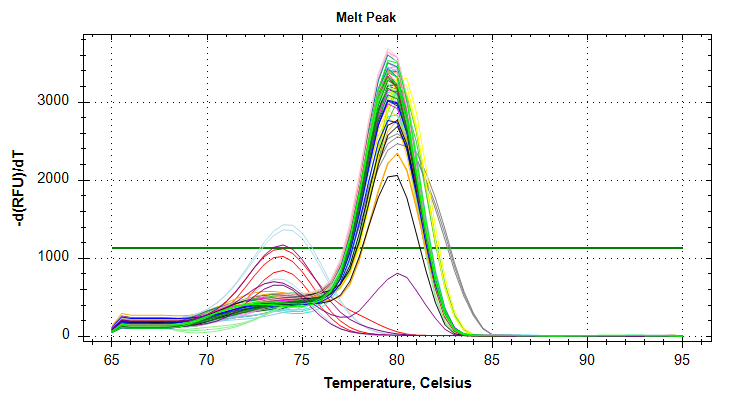
Citrate synthase: Amplification and melt plots look good. No amplification in NTCs. Reps are tight. Of note, samples14and29each have a single rep which exhibits very late amplification, while the remaining reps show no detectable amplification.ATP synthase: Amplification and melt plots look good. No amplification in NTCs. Reps are tight. Of note, sample14and29each has a single rep which exhibits very late amplification, while the remaining reps show no detectable amplification. Sample15has a large standard deviation, which can be attributed to a singel rep with a lower Cq value than the other two reps.cGAS: Amplification and melt plots look good. Reps are tight. Amplifciation is present in NTCs, but melt temp/peak is shifted significantly from samples. Additionally, this shifted peak is not present in all of the samples. As such, I believe this plate is fine for analysis.Of note, sample
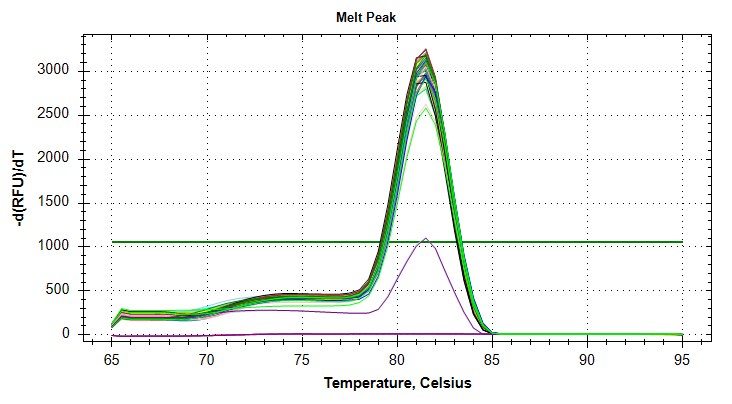
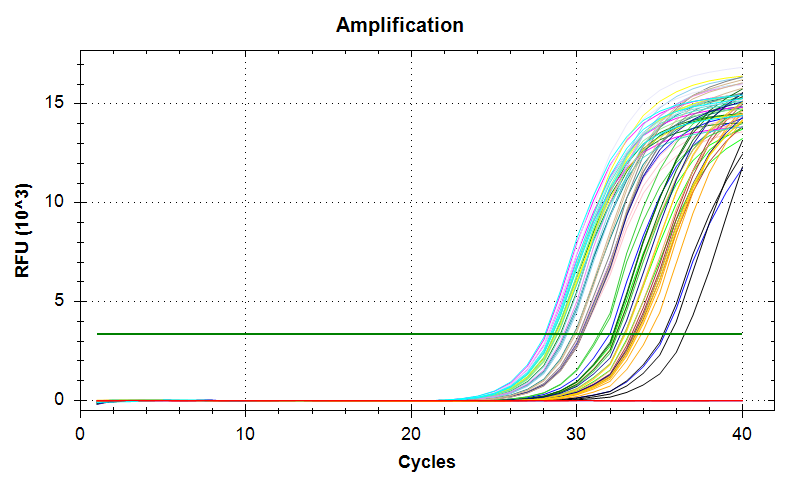
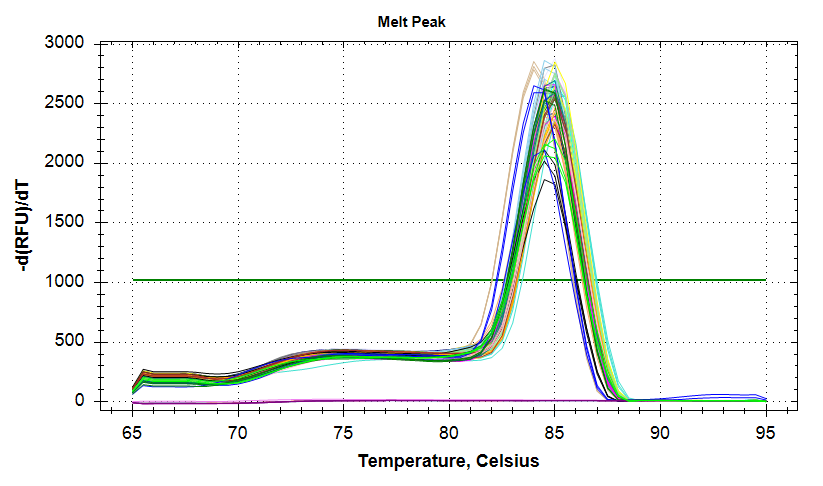
29has a large standard deviation, which can be attributed to a single rep with a higher Cq value than the other two reps.VIPERIN: Amplification and melt plots look good. No amplification in NTCs. Reps are tight.
Samples 18 and 75 have a large standard deviation. Although it appears due to a single rep with a much later Cq, the remaining two reps still differ by ~1.5 Cqs, which is too large a difference. Will repeat.
Files
*.pdf: qPCR Reports. Contains plate layouts, cycling params, amp/melt plots, etc.*Amplification-Results_SYBR.csv: Raw fluorescence data.*Cq-Results.csv: Cycle quantity (Cq) data.*.pcrd: Source qPCR data file. Requires CFX Maestro (Bio-Rad) software to open.
All files linked below are from commit b089754.
Also, this is all raw data. None of it has been normalized, so cannot interpret results from this data.
Citrate synthase
Cq Data
Report
Raw fluorescence
CFX File
ATP synthase
Cq Data
Report
Raw fluorescence
CFX File
cGAS
Cq Data
Report
Raw fluorescence
CFX File
VIPERIN
Cq Data
Report
Raw fluorescence
CFX File
Plots