INTRO
Continuing work with project-gigas-carryover lifestage_carryover (GitHub repo) after creating cDNA on 20250516, it was finally time to run the qPCRs.
This notebook describes how the qPCRs were run and links to the various output files. It also provides a brief overview of each primer set’s amplification profiles. This notebook does not have any analysis. This will be performed later.
MATERIALS & METHODS
Based on results from an initial round of qPCRs on 20240327 (Notebook entry), the following primer sets were run:
| SR ID | Primer Name |
|---|---|
| 1172 | Cg_GAPDH_205_F |
| 1173 | Cg_GAPDH_355_R |
| 599 | Cg_HSP70_F |
| 598 | Cg_HSP70_R |
| 1532 | Cg_Hsp90_F |
| 1533 | Cg_Hsp90_R |
| 1510 | Cg_DNMT1_F |
| 1511 | Cg_DNMT1_R |
All samples were run in triplicate, on low-profile, white 96-well plates (USA Scientific) in a CFX Connect (Bio-Rad) or CFX96 (Bio-Rad) real-time thermalcycler. All reactions consisted of the following:
| Component | Stock Concentration | Volume (uL) |
|---|---|---|
| cDNA | NA | 1 |
| SsoAdvanced Universal SYBR Green Supermix (BioRad) | 2x | 10 |
| PF | 10uM | 0.5 |
| PR | 10uM | 0.5 |
| H2O | NA | 8 |
| TOTAL | 20 |
Master mixes were distributed across one plate for each primer set and included no template controls (NTCs).
For cycling parameters, plate layouts, etc. see the RESULTS section below.
RESULTS
Summary
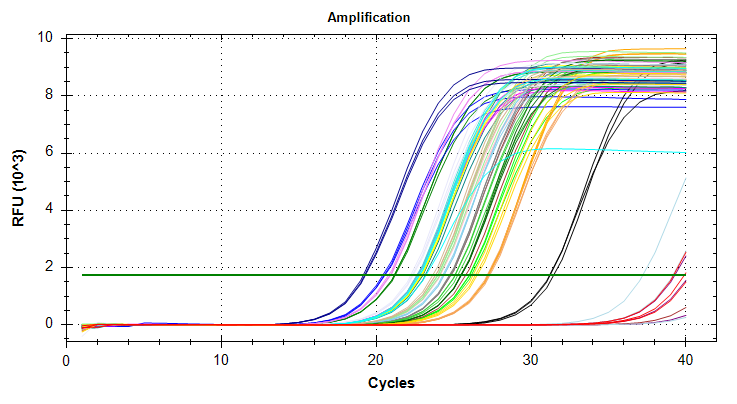
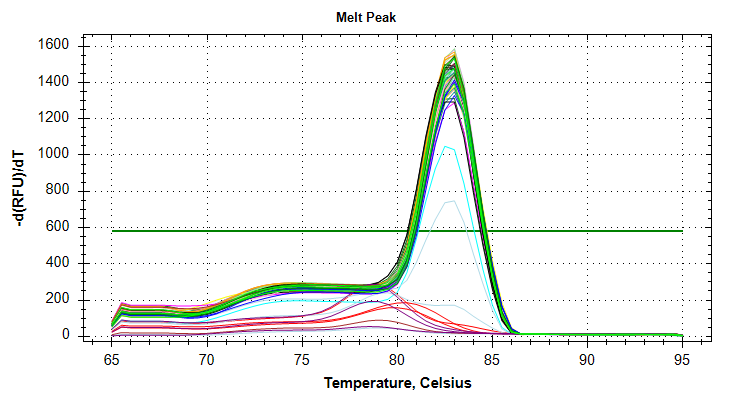
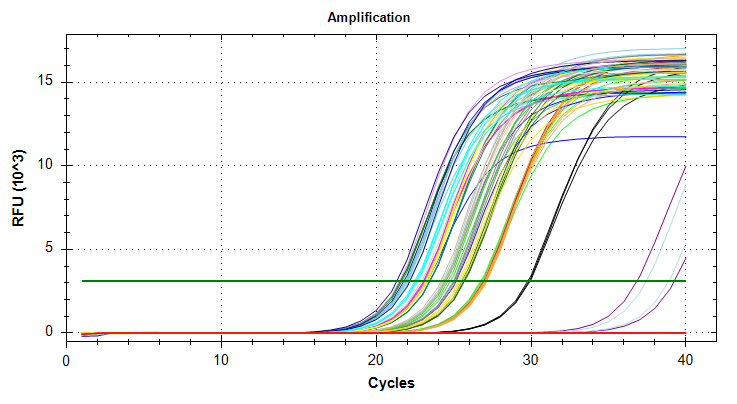
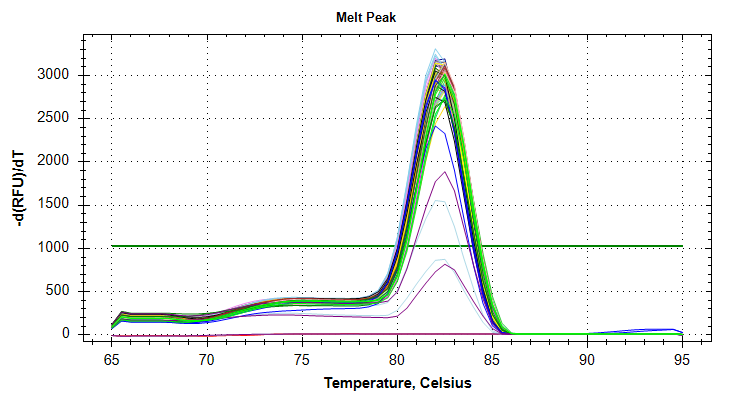
GAPDH: Amplification and melt plots only look okay. No template controls appear to have some amplification, however the melt curve of the NTCs is at a different temperature than the other samples. This suggests that the remainder of the samples are fine for analysis. Reps are tight.Of note, sample
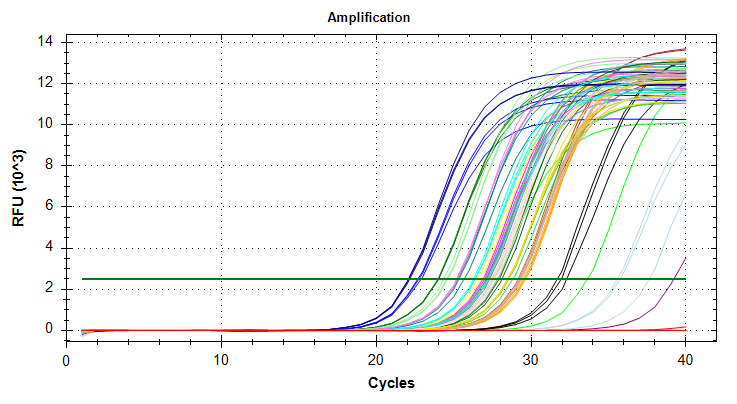
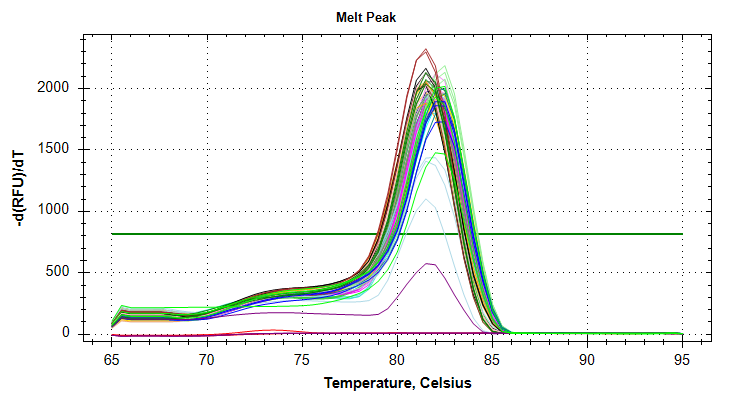
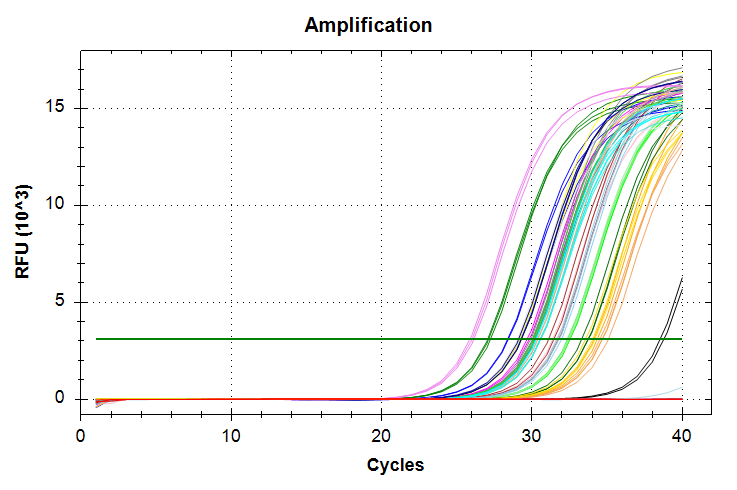
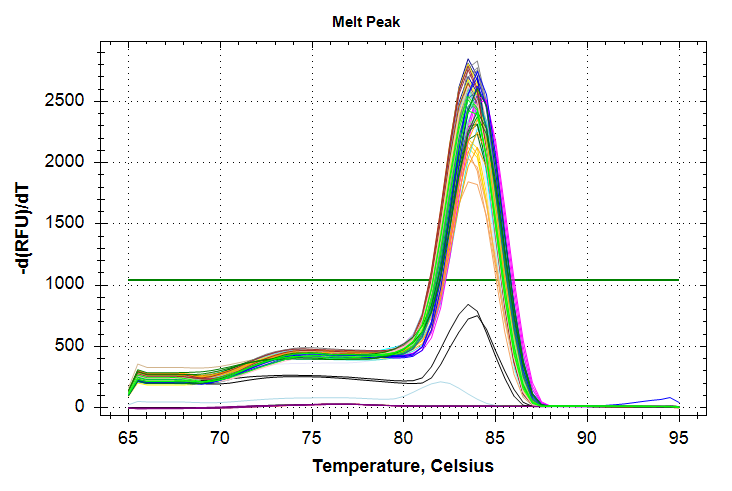
29has a standard deviation that is too large and will require repeating the qPCRs.HSP70: Amplification and melt plots look good. No amplification in NTCs. Reps are tight.HSP90: Amplification and melt plots look good. Reps are tight.Of note, samples
14,18, and29have each have a large standard deviation. These will need to be repeated.DNMT1: Amplification and melt plots look good. No amplification in NTCs. Reps are tight.
Files
*.pdf: qPCR Reports. Contains plate layouts, cycling params, amp/melt plots, etc.*Amplification-Results_SYBR.csv: Raw fluorescence data.*Cq-Results.csv: Cycle quantity (Cq) data.*.pcrd: Source qPCR data file. Requires CFX Maestro (Bio-Rad) software to open.
All files linked below are from commit b089754.
Also, this is all raw data. None of it has been normalized, so cannot interpret results from this data.
GAPDH
Cq Data
Report
Raw fluorescence
CFX File
HSP70
Cq Data
Report
Raw fluorescence
CFX File
HSP90
Cq Data
Report
Raw fluorescence
CFX File
DNMT1
Cq Data
Report
Raw fluorescence
CFX File
Plots