qPCR Analysis - M.gigas PolyIC Data from Valentinas Project
2026
qPCR
Pacific oyster
Magallana gigas
Crassostrea gigas
polyIC
HSP70
HSP90
cGAS
VIPERIN
ATP Synthase
Citrate Synthase
DNMT1
GAPDH
Author
Sam White
Published
February 2, 2026
INTRO
This is an analysis of qPCR data from Magallana gigas (Pacific oyster) samples treated with PolyIC (a synthetic analog of double-stranded RNA that mimics viral infection) and subjected to different stress types (Temperature, Mechanical, Control). The goal was to assess gene expression changes in response to these treatments.
The qPCR data was generated by me on January 27-29, 2026, as part of Valentina’s project on immune responses in oysters. Eight genes were targeted: ATP Synthase, Citrate Synthase, DNMT1, HSP70, HSP90, cGAS, and VIPERIN. GAPDH was used as the normalizing gene. Notebook entries documenting the qPCR runs and data exports can be found in the following posts:
I also managed to track down the qPCRs run on the RNA I isolated on isolated on 20250804. After RNA isolation, they were passed to Valentina for reverse transcription and qPCR. I believe those qPCRs were run/analyzed by Aakriti on 20250814 (Notebook entry). I found the files here:
I have not taken the time to evaluate the qPCRs run by Aakriti in detail. I’ve relied on the processing below to filter out samples with poor technical replicates. Maybe these can be revisited at a later date to see if any samples need to be re-run.
Code
knitr::opts_chunk$set(echo =TRUE, # Display code chunkseval =TRUE, # Evaluate code chunkswarning =FALSE, # Hide warningsmessage =FALSE, # Hide messagescomment =""# Prevents appending '##' to beginning of lines in code output)library(tidyverse)
── Attaching core tidyverse packages ──────────────────────── tidyverse 2.0.0 ──
✔ dplyr     1.2.1     ✔ readr     2.2.0
✔ forcats   1.0.1     ✔ stringr   1.6.0
✔ ggplot2   4.0.1     ✔ tibble    3.3.1
✔ lubridate 1.9.5     ✔ tidyr     1.3.2
✔ purrr     1.2.1
── Conflicts ────────────────────────────────────────── tidyverse_conflicts() ──
✖ dplyr::filter() masks stats::filter()
✖ dplyr::lag()    masks stats::lag()
ℹ Use the conflicted package (<http://conflicted.r-lib.org/>) to force all conflicts to become errors
Code
library(ggplot2)library(car)
Loading required package: carData

Attaching package: 'car'

The following object is masked from 'package:dplyr':

    recode

The following object is masked from 'package:purrr':

    some
Code
library(emmeans)
Welcome to emmeans.
Caution: You lose important information if you filter this package's results.
See '? untidy'
Code
library(multcomp)
Loading required package: mvtnorm
Loading required package: survival
Loading required package: TH.data
Loading required package: MASS

Attaching package: 'MASS'

The following object is masked from 'package:dplyr':

    select


Attaching package: 'TH.data'

The following object is masked from 'package:MASS':

    geyser
# Remove rows with Sample name "NTC" or empty/NA Sample namesqpcr_data <- qpcr_data %>%filter(Sample !="NTC"&!is.na(Sample) & Sample !="")str(qpcr_data)
'data.frame':   2463 obs. of  16 variables:
 $ X                     : logi  NA NA NA NA NA NA ...
 $ Well                  : chr  "A01" "A02" "A03" "A04" ...
 $ Fluor                 : chr  "SYBR" "SYBR" "SYBR" "SYBR" ...
 $ Target                : chr  "Citrate.Synthase" "Citrate.Synthase" "Citrate.Synthase" "Citrate.Synthase" ...
 $ Content               : chr  "Unkn-01" "Unkn-01" "Unkn-01" "Unkn-02" ...
 $ Sample                : chr  "A1C" "A1C" "A1C" "A2C" ...
 $ Biological.Set.Name   : logi  NA NA NA NA NA NA ...
 $ Cq                    : num  24.1 24 23.8 25.1 24.7 ...
 $ Cq.Mean               : num  23.9 23.9 23.9 24.9 24.9 ...
 $ Cq.Std..Dev           : num  0.147 0.147 0.147 0.208 0.208 ...
 $ Starting.Quantity..SQ.: num  NaN NaN NaN NaN NaN NaN NaN NaN NaN NaN ...
 $ Log.Starting.Quantity : num  NaN NaN NaN NaN NaN NaN NaN NaN NaN NaN ...
 $ SQ.Mean               : num  NaN NaN NaN NaN NaN NaN NaN NaN NaN NaN ...
 $ SQ.Std..Dev           : num  NaN NaN NaN NaN NaN NaN NaN NaN NaN NaN ...
 $ Set.Point             : int  60 60 60 60 60 60 60 60 60 60 ...
 $ Well.Note             : logi  NA NA NA NA NA NA ...
Check for high standard deviations
Code
# Filter out rows where Cq.Std..Dev is NAqpcr_data <- qpcr_data[!is.na(qpcr_data$Cq.Std..Dev), ]# Filter rows where Cq.Std..Dev is greater than 0.5high_cq_std_dev <- qpcr_data[qpcr_data$Cq.Std..Dev >0.5, ]# Print the filtered rows with specified columns, without row namesprint(high_cq_std_dev[, c("Target", "Sample", "Cq", "Cq.Std..Dev")], row.names =FALSE)
# Group by Sample and Target, then filter out the outlier replicateqpcr_filtered <- qpcr_data %>%group_by(Sample, Target) %>%filter(n() ==1|abs(Cq -median(Cq, na.rm =TRUE)) <=0.5) %>%ungroup()str(qpcr_filtered)
tibble [2,335 × 16] (S3: tbl_df/tbl/data.frame)
 $ X                     : logi [1:2335] NA NA NA NA NA NA ...
 $ Well                  : chr [1:2335] "A01" "A02" "A03" "A04" ...
 $ Fluor                 : chr [1:2335] "SYBR" "SYBR" "SYBR" "SYBR" ...
 $ Target                : chr [1:2335] "Citrate.Synthase" "Citrate.Synthase" "Citrate.Synthase" "Citrate.Synthase" ...
 $ Content               : chr [1:2335] "Unkn-01" "Unkn-01" "Unkn-01" "Unkn-02" ...
 $ Sample                : chr [1:2335] "A1C" "A1C" "A1C" "A2C" ...
 $ Biological.Set.Name   : logi [1:2335] NA NA NA NA NA NA ...
 $ Cq                    : num [1:2335] 24.1 24 23.8 25.1 24.7 ...
 $ Cq.Mean               : num [1:2335] 23.9 23.9 23.9 24.9 24.9 ...
 $ Cq.Std..Dev           : num [1:2335] 0.147 0.147 0.147 0.208 0.208 ...
 $ Starting.Quantity..SQ.: num [1:2335] NaN NaN NaN NaN NaN NaN NaN NaN NaN NaN ...
 $ Log.Starting.Quantity : num [1:2335] NaN NaN NaN NaN NaN NaN NaN NaN NaN NaN ...
 $ SQ.Mean               : num [1:2335] NaN NaN NaN NaN NaN NaN NaN NaN NaN NaN ...
 $ SQ.Std..Dev           : num [1:2335] NaN NaN NaN NaN NaN NaN NaN NaN NaN NaN ...
 $ Set.Point             : int [1:2335] 60 60 60 60 60 60 60 60 60 60 ...
 $ Well.Note             : logi [1:2335] NA NA NA NA NA NA ...
Samples excluded due to quality control
Code
# Identify samples that were filtered outall_samples <- qpcr_data %>% dplyr::select(Sample, Target) %>%distinct()retained_samples <- qpcr_filtered %>% dplyr::select(Sample, Target) %>%distinct()excluded_samples <- all_samples %>%anti_join(retained_samples, by =c("Sample", "Target"))if(nrow(excluded_samples) >0) {cat("Samples excluded from analysis due to high standard deviation (> 0.5):\n\n") excluded_samples %>%arrange(Target, Sample) %>% knitr::kable()} else {cat("No samples were excluded from the analysis.\n")}
Samples excluded from analysis due to high standard deviation (> 0.5):
Sample
Target
B1PM
ATP.Synthase
B2PM
ATP.Synthase
A2PM
Citrate.Synthase
D4PM
DNMT1
Group and Summarize Data
Code
# Group by Sample and Target, then summarize to get unique rows for each samplegrouped_df <- qpcr_filtered %>%group_by(Sample, Target) %>%summarise(Cq.Mean =mean(Cq, na.rm =TRUE),Cq.Std..Dev =sd(Cq, na.rm =TRUE),.groups ='drop' )str(grouped_df)
# Calculate delta Cq by subtracting GAPDH Cq.Mean from each corresponding Sample Cq.Meandelta_Cq_df <-calculate_delta_Cq(grouped_df)# Filter out normalizing gene (GAPDH), since no need to compare normalizing gene to itselfdelta_Cq_df <- delta_Cq_df %>%filter(Target !="GAPDH")str(delta_Cq_df)
cat("\n=== GAPDH QC FAILURES AND THEIR CASCADE EFFECTS ===\n\n")# Get samples where GAPDH passed QCgapdh_passed <- grouped_df %>%filter(Target =="GAPDH") %>% dplyr::select(Sample) %>%distinct() %>%pull(Sample)# Get samples where genes of interest passed QCgenes_of_interest <- grouped_df %>%filter(Target !="GAPDH") %>% dplyr::select(Sample, Target) %>%distinct()# Find samples that have gene data but missing GAPDHsamples_with_gene_but_no_gapdh <- genes_of_interest %>%filter(!Sample %in% gapdh_passed) %>%arrange(Sample, Target)if(nrow(samples_with_gene_but_no_gapdh) >0) {cat("**Samples with good gene measurements but failed/missing GAPDH:**\n")cat("(These samples CANNOT be normalized and are excluded from analysis)\n\n")# Count by sample sample_counts <- samples_with_gene_but_no_gapdh %>%group_by(Sample) %>%summarise(n_genes_lost =n(), .groups ="drop") %>%arrange(desc(n_genes_lost), Sample)cat("Total samples affected:", nrow(sample_counts), "\n")cat("Total gene measurements lost:", nrow(samples_with_gene_but_no_gapdh), "\n\n")# Detailed breakdownfor(i in1:nrow(sample_counts)) { samp <- sample_counts$Sample[i] genes_lost <- samples_with_gene_but_no_gapdh %>%filter(Sample == samp) %>%pull(Target)cat(" ", samp, " (", sample_counts$n_genes_lost[i], " genes lost): ", paste(genes_lost, collapse =", "), "\n", sep ="") }} else {cat("**Good news!** All samples with gene measurements also have valid GAPDH.\n")}# Check if GAPDH itself failed QC for any samplesgapdh_failed_qc <- excluded_samples %>%filter(Target =="GAPDH") %>%pull(Sample) %>%unique()if(length(gapdh_failed_qc) >0) {cat("\n\n**GAPDH samples that failed QC (Std Dev > 0.5):** ", length(gapdh_failed_qc), " samples\n", sep ="")cat(" ", paste(sort(gapdh_failed_qc), collapse =", "), "\n", sep ="")cat("\nNote: These GAPDH failures prevent normalization for ALL genes in these samples,\n")cat("even if those genes had good quality measurements.\n")} else {cat("\n\n**No GAPDH samples failed QC.**\n")}# Identify which "missing" samples in the final analysis are due to GAPDH issuescat("\n\n**Analysis of 'Missing' Samples:**\n\n")# Get samples that made it to grouped_df (passed initial QC)all_passed_qc <- grouped_df %>% dplyr::select(Sample, Target) %>%distinct()# For each "missing" sample in delta_Cq_df, check if the gene passed QC but GAPDH didn'tmissing_due_to_gapdh <- missing_combinations %>%inner_join(all_passed_qc, by =c("Sample", "Target")) %>%filter(!Sample %in% gapdh_passed)if(nrow(missing_due_to_gapdh) >0) {cat("Gene measurements lost due to GAPDH failure/missing: ", nrow(missing_due_to_gapdh), " sample-gene combinations\n\n", sep ="") missing_gapdh_summary <- missing_due_to_gapdh %>%group_by(Target) %>%summarise(n =n(), .groups ="drop") %>%arrange(desc(n))cat("Breakdown by gene:\n")for(i in1:nrow(missing_gapdh_summary)) {cat(" ", missing_gapdh_summary$Target[i], ": ", missing_gapdh_summary$n[i], " samples\n", sep ="") }} else {cat("None of the 'missing' samples are due to GAPDH QC failures.\n")cat("(They were never run/loaded for those genes)\n")}
=== GAPDH QC FAILURES AND THEIR CASCADE EFFECTS ===

**Good news!** All samples with gene measurements also have valid GAPDH.


**No GAPDH samples failed QC.**


**Analysis of 'Missing' Samples:**

None of the 'missing' samples are due to GAPDH QC failures.
(They were never run/loaded for those genes)
Statistical Comparisons
T-tests for treatment comparisons
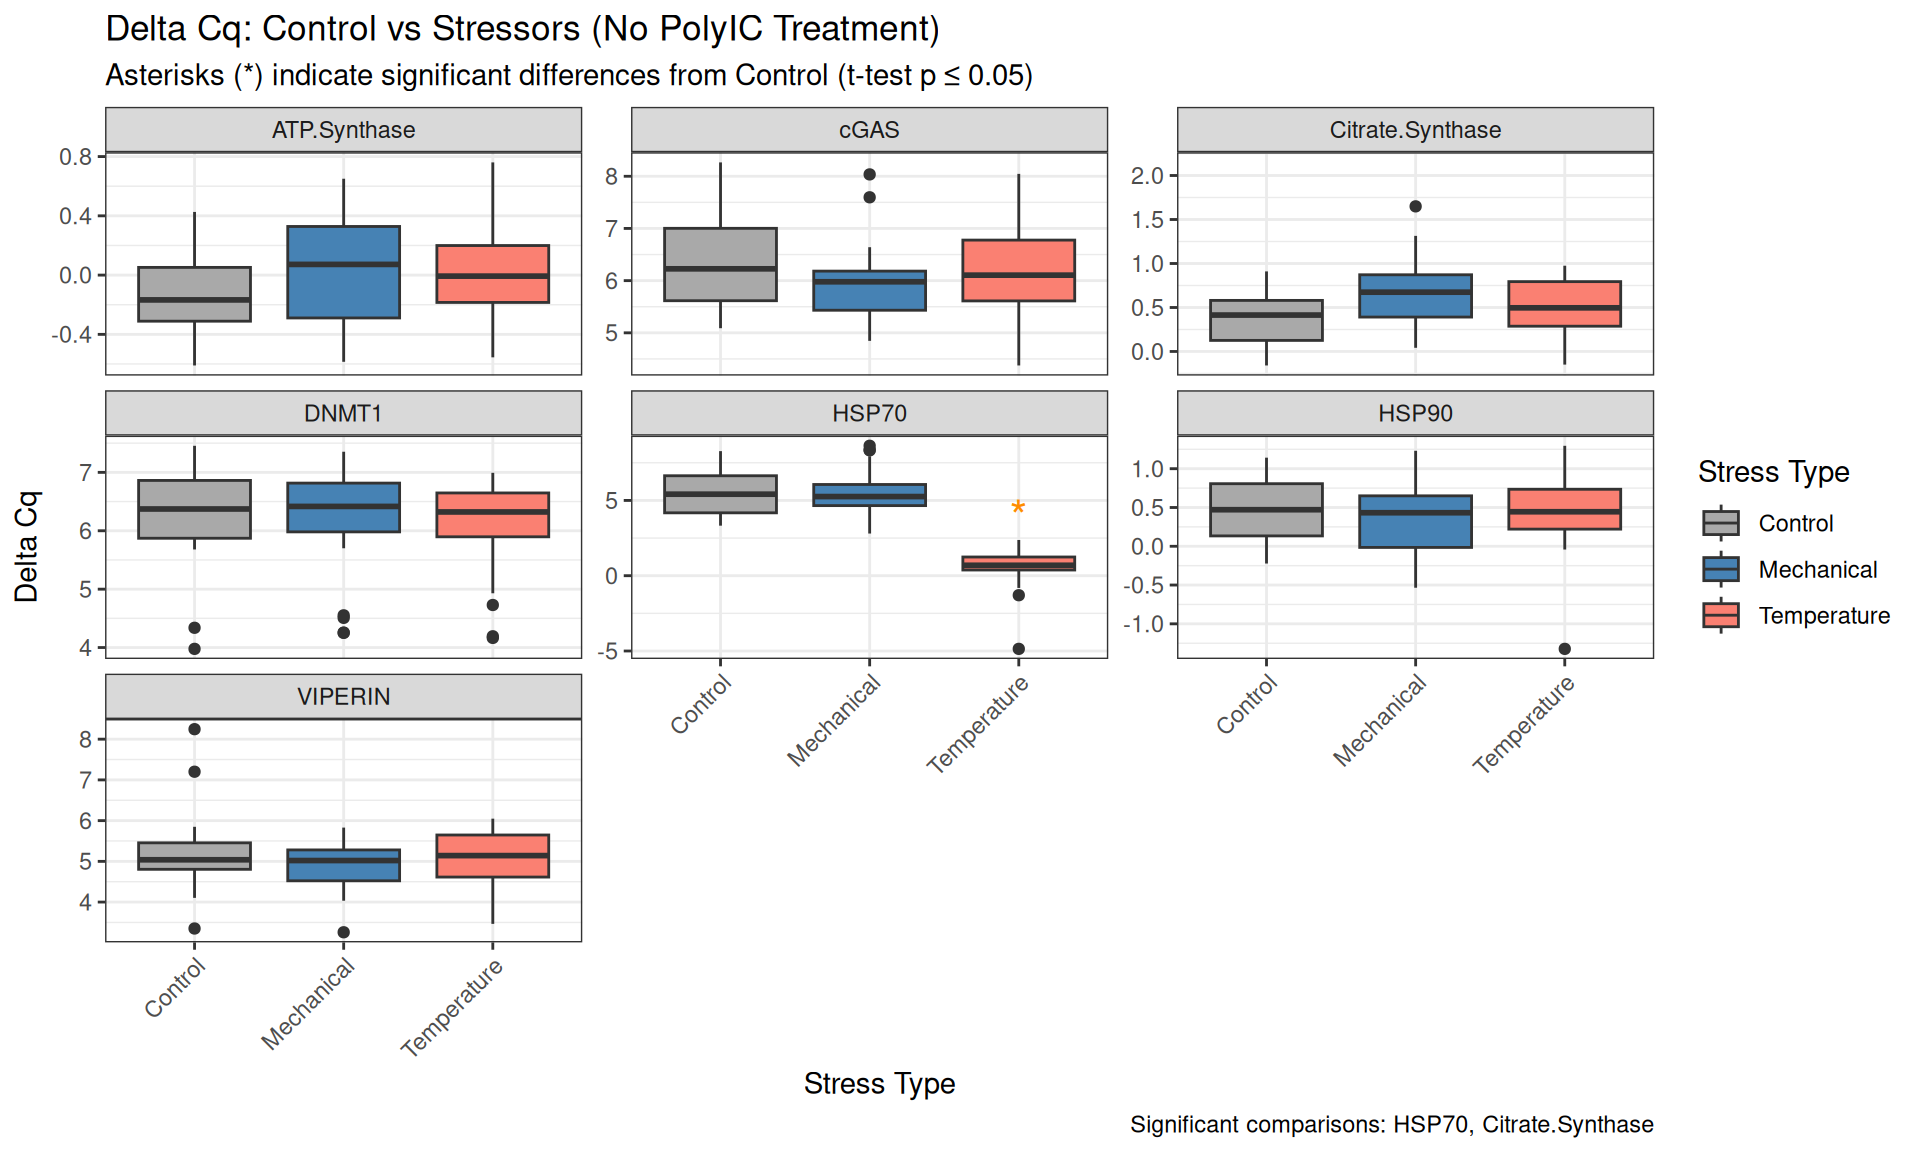
Comparison 1: Basic Control vs Stressors (No PolyIC)
Code
# Filter data for samples without PolyIC treatmentno_polyIC_data <- delta_Cq_df %>%filter(polyIC =="No_PolyIC")# Perform t-tests for each target comparing Control vs each stressorcomparison1_results <- no_polyIC_data %>%filter(stress_type %in%c("Control", "Temperature", "Mechanical")) %>%group_by(Target) %>%summarise(# Control vs Temperaturetemp_pvalue =if(sum(stress_type =="Control") >0&sum(stress_type =="Temperature") >0) {t.test(delta_Cq[stress_type =="Control"], delta_Cq[stress_type =="Temperature"])$p.value } elseNA_real_,# Control vs Mechanicalmech_pvalue =if(sum(stress_type =="Control") >0&sum(stress_type =="Mechanical") >0) {t.test(delta_Cq[stress_type =="Control"], delta_Cq[stress_type =="Mechanical"])$p.value } elseNA_real_,.groups ='drop' )print(comparison1_results)
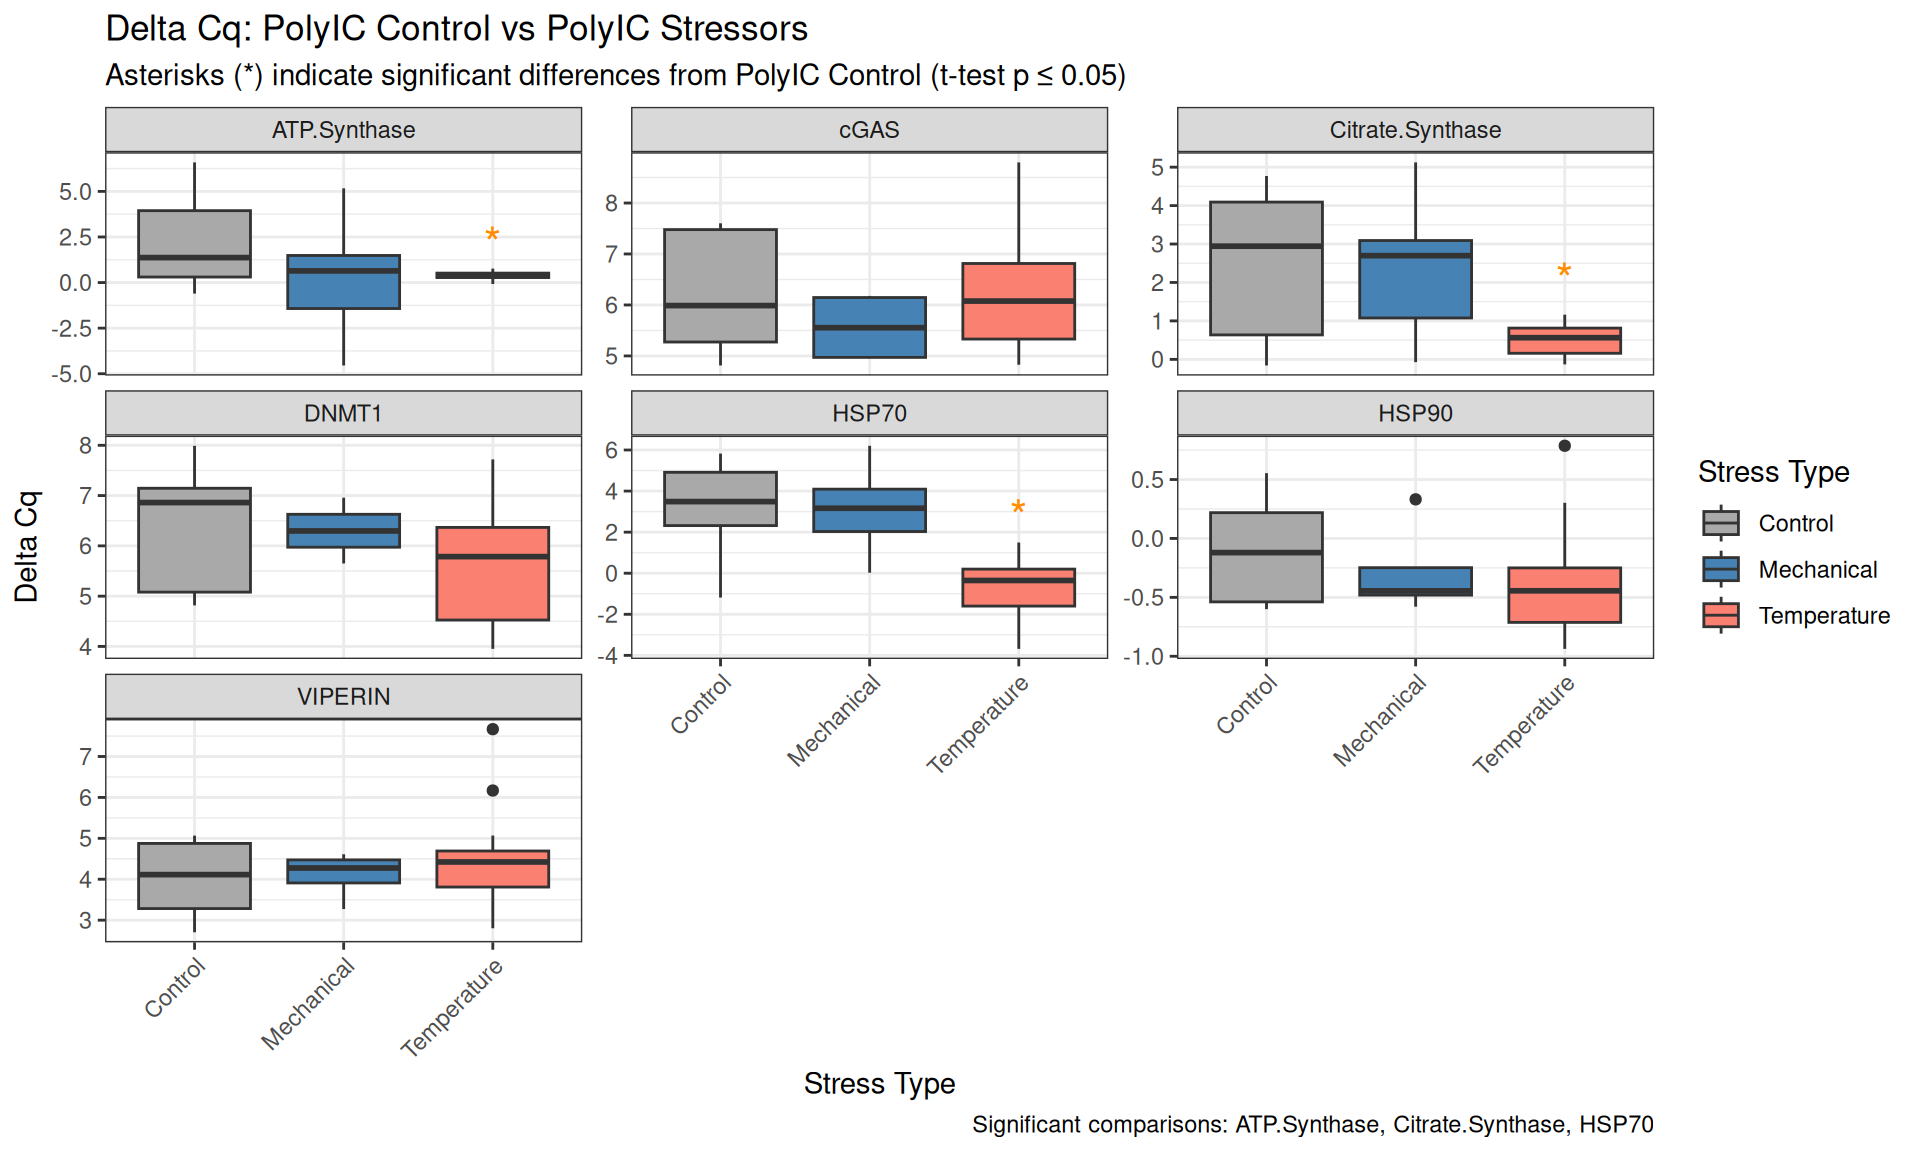
# Identify genes with significant p-values for Temperature comparisonsig_temp_polyIC <- comparison3_results %>%filter(temp_pvalue <=0.05&!is.na(temp_pvalue)) %>% dplyr::select(Target, pvalue = temp_pvalue) %>%mutate(comparison ="PolyIC Control vs Temperature")# Identify genes with significant p-values for Mechanical comparisonsig_mech_polyIC <- comparison3_results %>%filter(mech_pvalue <=0.05&!is.na(mech_pvalue)) %>% dplyr::select(Target, pvalue = mech_pvalue) %>%mutate(comparison ="PolyIC Control vs Mechanical")# Combine and displaysig_genes_comp3 <-bind_rows( sig_temp_polyIC, sig_mech_polyIC)if(nrow(sig_genes_comp3) >0) {print("Genes with p ≤ 0.05:") sig_genes_comp3 %>%mutate(pvalue =format(pvalue, scientific =TRUE, digits =3)) %>% knitr::kable()} else {print("No genes had p-values ≤ 0.05")}
[1] "Genes with p ≤ 0.05:"
Target
pvalue
comparison
ATP.Synthase
6.93e-03
PolyIC Control vs Temperature
Citrate.Synthase
5.19e-04
PolyIC Control vs Temperature
HSP70
4.61e-08
PolyIC Control vs Temperature
Create ANOVA Models
Two-way ANOVA (PolyIC × Stress Type) for each gene to comprehensively test treatment effects and interactions.
Code
# Run ANOVA models for all genes and store emmeans objects for plotting# Detailed assumption checks and interpretations are in the "ANOVA Results and Diagnostics" section below# ATP Synthasemodel_atp <- delta_Cq_df %>%filter(Target =="ATP.Synthase") %>%aov(delta_Cq ~ polyIC * stress_type, data = .)if(any(summary(model_atp)[[1]][["Pr(>F)"]][1:3] <0.05, na.rm =TRUE)) { emm_atp <-emmeans(model_atp, ~ polyIC * stress_type)}# Citrate Synthasemodel_citrate <- delta_Cq_df %>%filter(Target =="Citrate.Synthase") %>%aov(delta_Cq ~ polyIC * stress_type, data = .)if(any(summary(model_citrate)[[1]][["Pr(>F)"]][1:3] <0.05, na.rm =TRUE)) { emm_citrate <-emmeans(model_citrate, ~ polyIC * stress_type)}# DNMT1model_dnmt1 <- delta_Cq_df %>%filter(Target =="DNMT1") %>%aov(delta_Cq ~ polyIC * stress_type, data = .)if(any(summary(model_dnmt1)[[1]][["Pr(>F)"]][1:3] <0.05, na.rm =TRUE)) { emm_dnmt1 <-emmeans(model_dnmt1, ~ polyIC * stress_type)}# HSP70model_hsp70 <- delta_Cq_df %>%filter(Target =="HSP70") %>%aov(delta_Cq ~ polyIC * stress_type, data = .)if(any(summary(model_hsp70)[[1]][["Pr(>F)"]][1:3] <0.05, na.rm =TRUE)) { emm_hsp70 <-emmeans(model_hsp70, ~ polyIC * stress_type)}# HSP90model_hsp90 <- delta_Cq_df %>%filter(Target =="HSP90") %>%aov(delta_Cq ~ polyIC * stress_type, data = .)if(any(summary(model_hsp90)[[1]][["Pr(>F)"]][1:3] <0.05, na.rm =TRUE)) { emm_hsp90 <-emmeans(model_hsp90, ~ polyIC * stress_type)}# cGASmodel_cgas <- delta_Cq_df %>%filter(Target =="cGAS") %>%aov(delta_Cq ~ polyIC * stress_type, data = .)if(any(summary(model_cgas)[[1]][["Pr(>F)"]][1:3] <0.05, na.rm =TRUE)) { emm_cgas <-emmeans(model_cgas, ~ polyIC * stress_type)}# VIPERINmodel_viperin <- delta_Cq_df %>%filter(Target =="VIPERIN") %>%aov(delta_Cq ~ polyIC * stress_type, data = .)if(any(summary(model_viperin)[[1]][["Pr(>F)"]][1:3] <0.05, na.rm =TRUE)) { emm_viperin <-emmeans(model_viperin, ~ polyIC * stress_type)}cat("ANOVA models created for all genes. Emmeans objects stored for post-hoc testing and plotting.\n")cat("See 'ANOVA Results and Diagnostics' section below for detailed results, assumption checks, and interpretations.\n")
ANOVA models created for all genes. Emmeans objects stored for post-hoc testing and plotting.
See 'ANOVA Results and Diagnostics' section below for detailed results, assumption checks, and interpretations.
Visualizations
Delta Cq Boxplots
Comparison 1: Control vs Stressors (No PolyIC)
Code
# Prepare significance annotations from t-test resultsif(exists("sig_genes_comp1") &&nrow(sig_genes_comp1) >0) {# Extract significant genes for Temperature sig_temp_genes <- sig_genes_comp1 %>%filter(comparison =="Control vs Temperature") %>%pull(Target)# Extract significant genes for Mechanical sig_mech_genes <- sig_genes_comp1 %>%filter(comparison =="Control vs Mechanical") %>%pull(Target)# Create annotation data sig_annotations_comp1 <-data.frame(Target =character(),stress_type =character(),label =character(),stringsAsFactors =FALSE )# Add Temperature annotationsif(length(sig_temp_genes) >0) { sig_annotations_comp1 <-rbind(sig_annotations_comp1,data.frame(Target = sig_temp_genes,stress_type ="Temperature",label ="*")) }# Add Mechanical annotationsif(length(sig_mech_genes) >0) { sig_annotations_comp1 <-rbind(sig_annotations_comp1,data.frame(Target = sig_mech_genes,stress_type ="Mechanical",label ="*")) }# Get y positions for annotationsif(nrow(sig_annotations_comp1) >0) { y_pos_comp1 <- no_polyIC_data %>%group_by(Target, stress_type) %>%summarise(max_y =max(delta_Cq, na.rm =TRUE), .groups ="drop") sig_annotations_comp1 <- sig_annotations_comp1 %>%left_join(y_pos_comp1, by =c("Target", "stress_type")) %>%mutate(y_pos = max_y +0.5) }} else { sig_annotations_comp1 <-data.frame()}# Create plotp <- no_polyIC_data %>%ggplot(aes(x = stress_type, y = delta_Cq, fill = stress_type)) +geom_boxplot() +facet_wrap(~Target, scales ="free_y") +scale_fill_manual(values =c("Control"="darkgray", "Temperature"="salmon", "Mechanical"="steelblue")) +coord_cartesian(clip ="off") +theme_bw() +labs(title ="Delta Cq: Control vs Stressors (No PolyIC Treatment)",x ="Stress Type",y ="Delta Cq",fill ="Stress Type" ) +theme(axis.text.x =element_text(angle =45, hjust =1))# Add annotations if any existif(nrow(sig_annotations_comp1) >0) { p <- p +geom_text(data = sig_annotations_comp1, aes(x = stress_type, y = y_pos, label = label),inherit.aes =FALSE, size =6, vjust =0, color ="darkorange") +labs(subtitle ="Asterisks (*) indicate significant differences from Control (t-test p ≤ 0.05)",caption =paste("Significant comparisons:", paste(unique(sig_genes_comp1$Target), collapse =", ")))} else { p <- p +labs(subtitle ="No significant differences detected in t-tests (all p > 0.05)")}print(p)
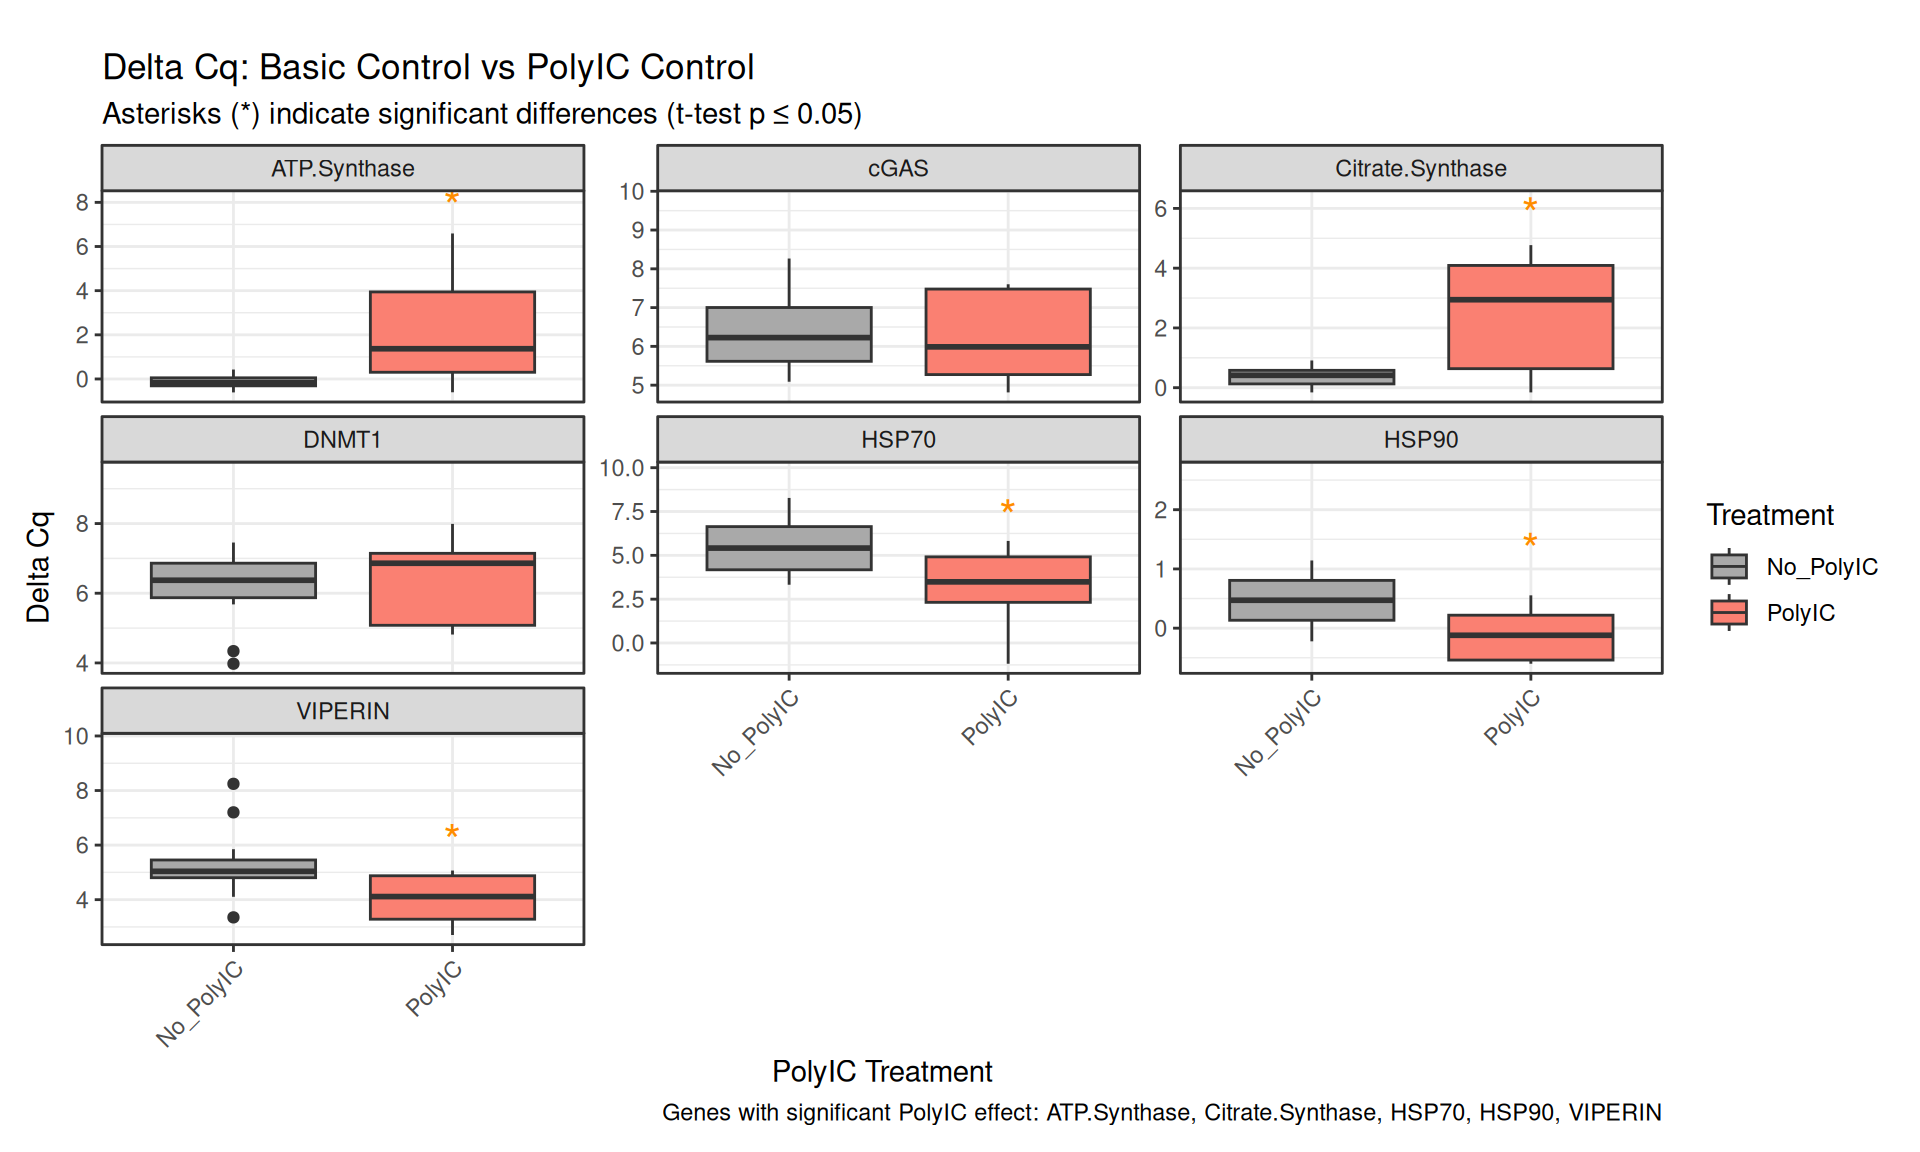
Comparison 2: Control vs PolyIC Control
Code
# Prepare significance annotations from t-test resultsif(exists("sig_genes_comp2") &&nrow(sig_genes_comp2) >0) { sig_annotations_comp2 <-data.frame(Target = sig_genes_comp2$Target,polyIC ="PolyIC",label ="*",stringsAsFactors =FALSE )# Get y positions for annotations y_pos_comp2 <- control_data %>%group_by(Target, polyIC) %>%summarise(max_y =max(delta_Cq, na.rm =TRUE), .groups ="drop") sig_annotations_comp2 <- sig_annotations_comp2 %>%left_join(y_pos_comp2, by =c("Target", "polyIC")) %>%mutate(y_pos = max_y +0.5)} else { sig_annotations_comp2 <-data.frame()}# Create plotp <- control_data %>%ggplot(aes(x = polyIC, y = delta_Cq, fill = polyIC)) +geom_boxplot() +facet_wrap(~Target, scales ="free_y") +scale_fill_manual(values =c("No_PolyIC"="darkgray", "PolyIC"="salmon")) +coord_cartesian(clip ="off") +theme_bw() +labs(title ="Delta Cq: Basic Control vs PolyIC Control",x ="PolyIC Treatment",y ="Delta Cq",fill ="Treatment" ) +theme(axis.text.x =element_text(angle =45, hjust =1),plot.margin =margin(t =20, r =10, b =10, l =10) )# Add annotations if any existif(nrow(sig_annotations_comp2) >0) {# Expand y-axis limits to ensure annotations are visible y_limits_comp2 <- control_data %>%group_by(Target) %>%summarise(y_min =min(delta_Cq, na.rm =TRUE) -0.5,y_max =max(delta_Cq, na.rm =TRUE) +1.5,.groups ="drop" ) p <- p +geom_blank(data = y_limits_comp2, aes(x =1, y = y_max), inherit.aes =FALSE) +geom_text(data = sig_annotations_comp2, aes(x = polyIC, y = y_pos, label = label),inherit.aes =FALSE, size =6, vjust =0, color ="darkorange") +labs(subtitle ="Asterisks (*) indicate significant differences (t-test p ≤ 0.05)",caption =paste("Genes with significant PolyIC effect:", paste(sig_genes_comp2$Target, collapse =", ")))} else { p <- p +labs(subtitle ="No significant differences detected in t-tests (all p > 0.05)")}print(p)
Comparison 3: PolyIC Control vs PolyIC Stressors
Code
# Prepare significance annotations from t-test resultsif(exists("sig_genes_comp3") &&nrow(sig_genes_comp3) >0) {# Extract significant genes for Temperature sig_temp_genes <- sig_genes_comp3 %>%filter(comparison =="PolyIC Control vs Temperature") %>%pull(Target)# Extract significant genes for Mechanical sig_mech_genes <- sig_genes_comp3 %>%filter(comparison =="PolyIC Control vs Mechanical") %>%pull(Target)# Create annotation data sig_annotations_comp3 <-data.frame(Target =character(),stress_type =character(),label =character(),stringsAsFactors =FALSE )# Add Temperature annotationsif(length(sig_temp_genes) >0) { sig_annotations_comp3 <-rbind(sig_annotations_comp3,data.frame(Target = sig_temp_genes,stress_type ="Temperature",label ="*")) }# Add Mechanical annotationsif(length(sig_mech_genes) >0) { sig_annotations_comp3 <-rbind(sig_annotations_comp3,data.frame(Target = sig_mech_genes,stress_type ="Mechanical",label ="*")) }# Get y positions for annotationsif(nrow(sig_annotations_comp3) >0) { y_pos_comp3 <- polyIC_data %>%group_by(Target, stress_type) %>%summarise(max_y =max(delta_Cq, na.rm =TRUE), .groups ="drop") sig_annotations_comp3 <- sig_annotations_comp3 %>%left_join(y_pos_comp3, by =c("Target", "stress_type")) %>%mutate(y_pos = max_y +0.5) }} else { sig_annotations_comp3 <-data.frame()}# Create plotp <- polyIC_data %>%ggplot(aes(x = stress_type, y = delta_Cq, fill = stress_type)) +geom_boxplot() +facet_wrap(~Target, scales ="free_y") +scale_fill_manual(values =c("Control"="darkgray", "Temperature"="salmon", "Mechanical"="steelblue")) +theme_bw() +labs(title ="Delta Cq: PolyIC Control vs PolyIC Stressors",x ="Stress Type",y ="Delta Cq",fill ="Stress Type" ) +theme(axis.text.x =element_text(angle =45, hjust =1))# Add annotations if any existif(nrow(sig_annotations_comp3) >0) { p <- p +geom_text(data = sig_annotations_comp3, aes(x = stress_type, y = y_pos, label = label),inherit.aes =FALSE, size =6, vjust =0, color ="darkorange") +labs(subtitle ="Asterisks (*) indicate significant differences from PolyIC Control (t-test p ≤ 0.05)",caption =paste("Significant comparisons:", paste(unique(sig_genes_comp3$Target), collapse =", ")))} else { p <- p +labs(subtitle ="No significant differences detected in t-tests (all p > 0.05)")}print(p)
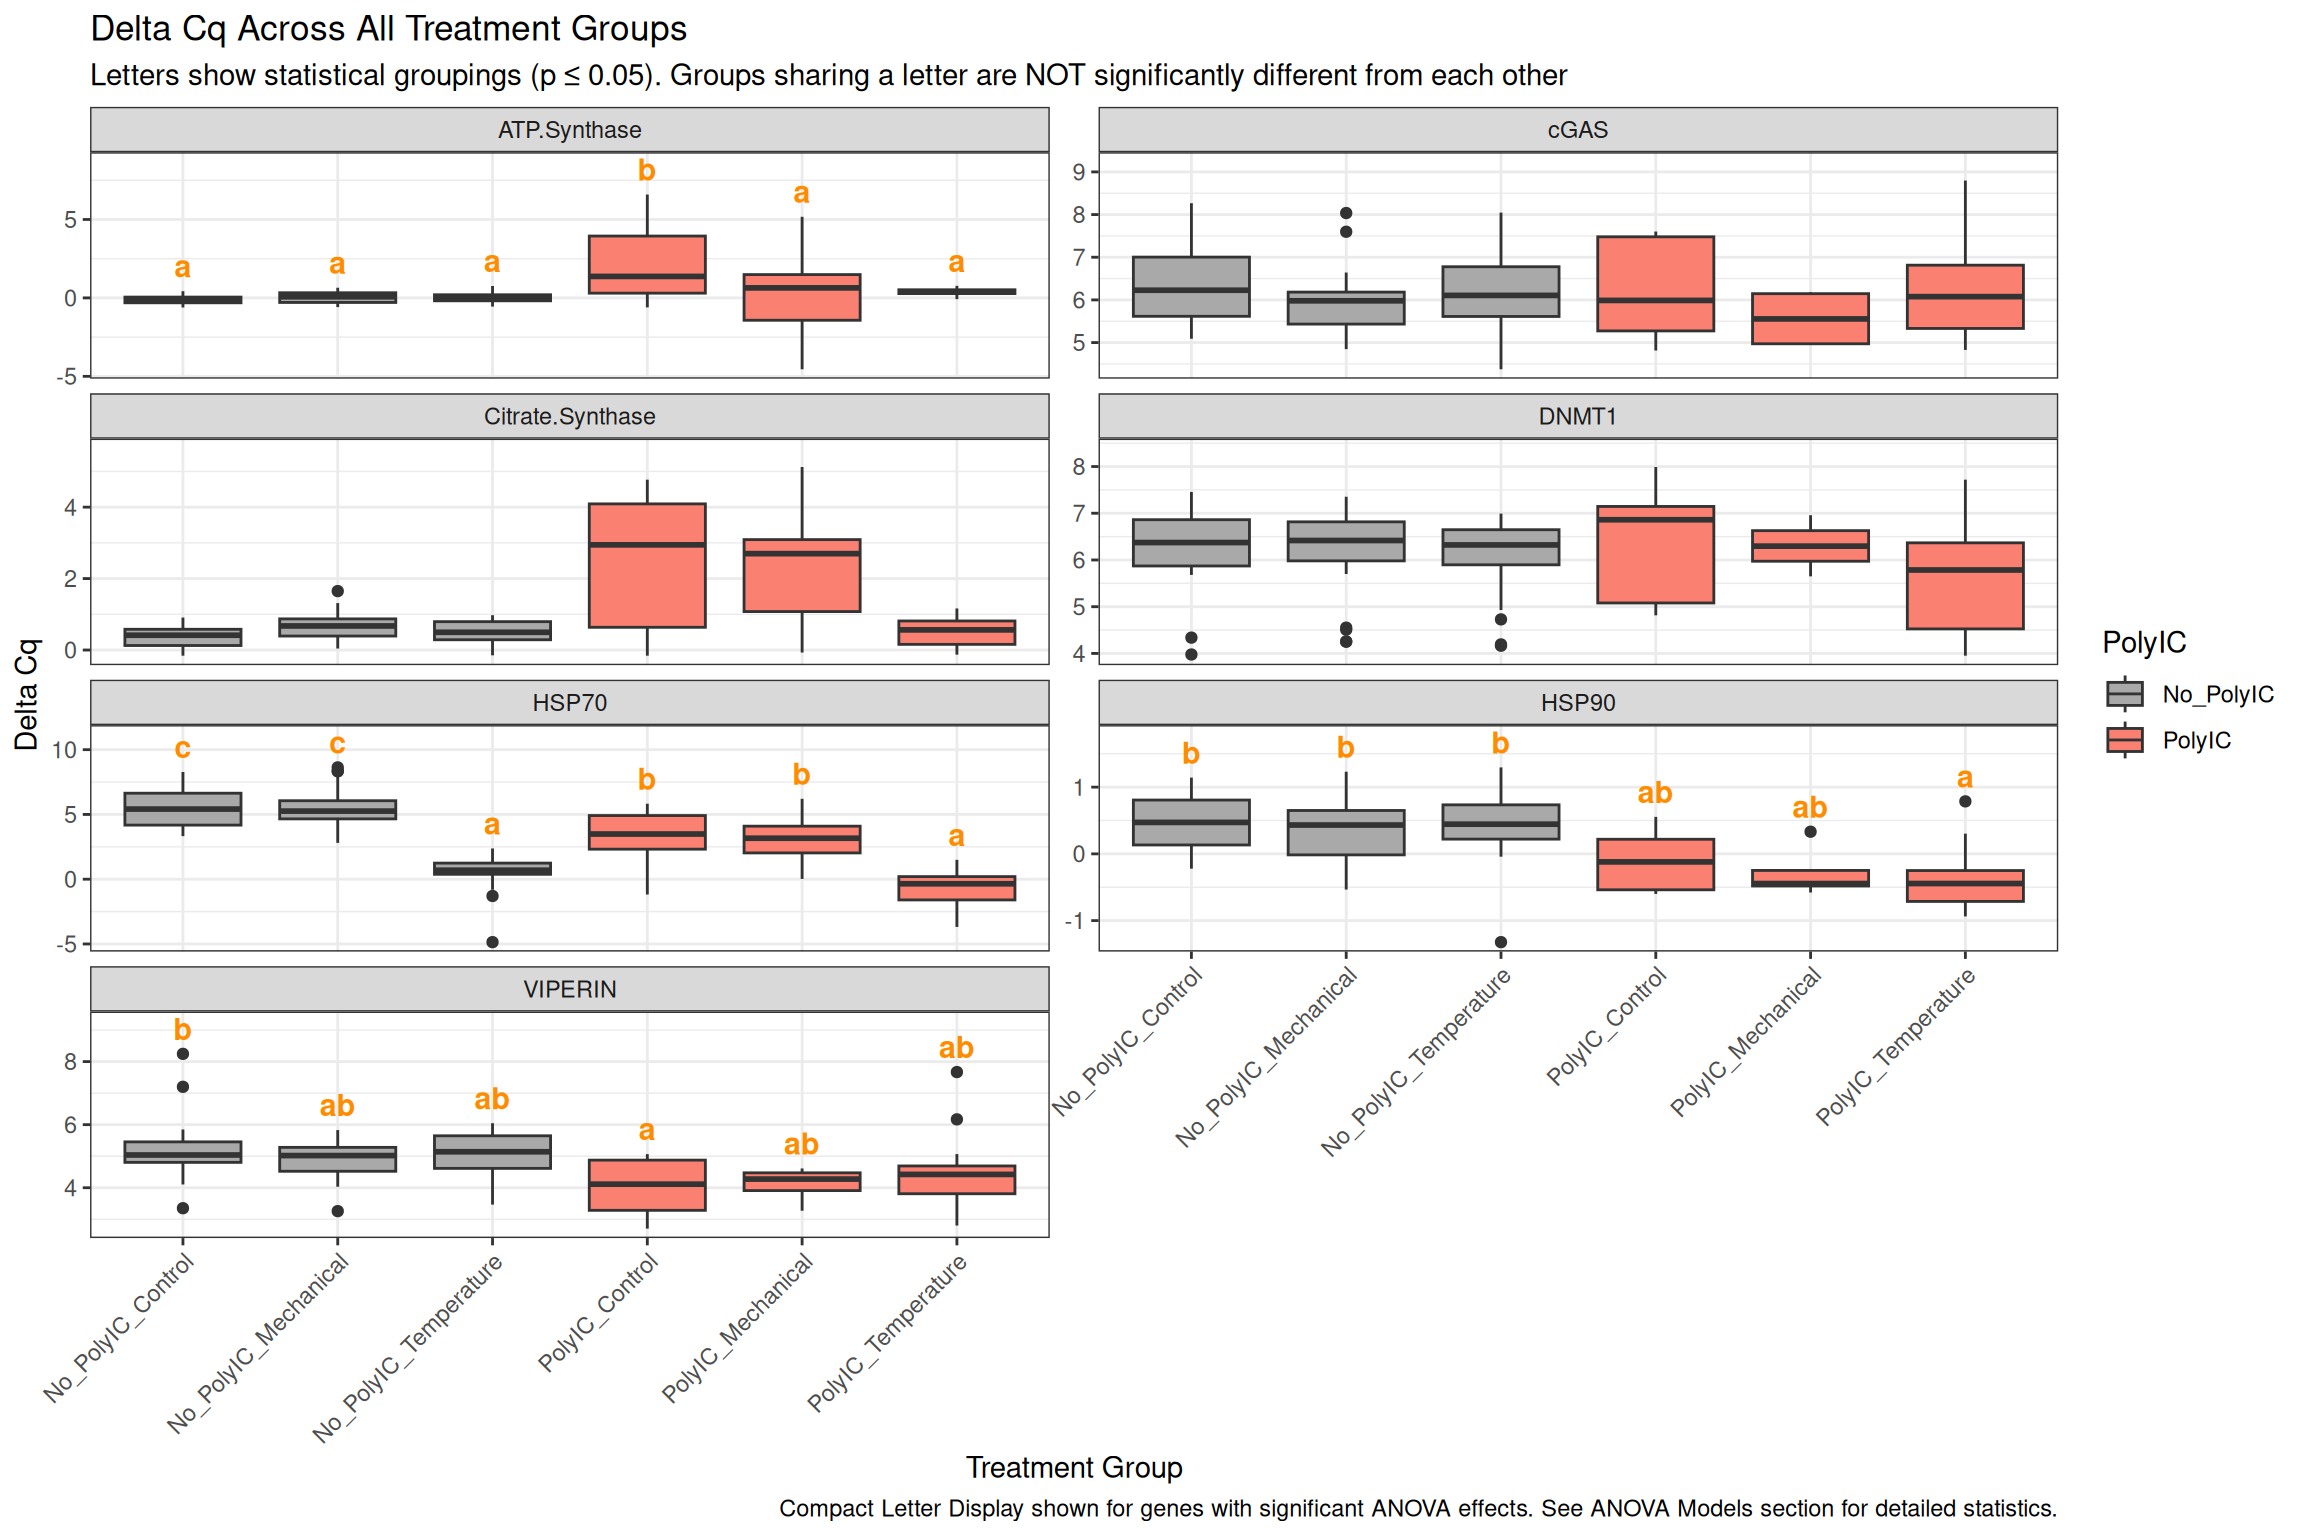
All treatments comparison
Code
# Use emmeans objects created in Statistical Comparisons sectionall_treat_annotations <-data.frame()# ATP Synthaseif(exists("emm_atp")) { cld_temp <-cld(emm_atp, Letters = letters, alpha =0.05) cld_df <-as.data.frame(cld_temp) cld_df$Target <-"ATP.Synthase" cld_df$label <-trimws(cld_df$.group) cld_df$treatment_group <-paste(cld_df$polyIC, cld_df$stress_type, sep ="_") all_treat_annotations <-rbind(all_treat_annotations, cld_df[, c("Target", "treatment_group", "label")])}# HSP70if(exists("emm_hsp70")) { cld_temp <-cld(emm_hsp70, Letters = letters, alpha =0.05) cld_df <-as.data.frame(cld_temp) cld_df$Target <-"HSP70" cld_df$label <-trimws(cld_df$.group) cld_df$treatment_group <-paste(cld_df$polyIC, cld_df$stress_type, sep ="_") all_treat_annotations <-rbind(all_treat_annotations, cld_df[, c("Target", "treatment_group", "label")])}# HSP90if(exists("emm_hsp90")) { cld_temp <-cld(emm_hsp90, Letters = letters, alpha =0.05) cld_df <-as.data.frame(cld_temp) cld_df$Target <-"HSP90" cld_df$label <-trimws(cld_df$.group) cld_df$treatment_group <-paste(cld_df$polyIC, cld_df$stress_type, sep ="_") all_treat_annotations <-rbind(all_treat_annotations, cld_df[, c("Target", "treatment_group", "label")])}# VIPERINif(exists("emm_viperin")) { cld_temp <-cld(emm_viperin, Letters = letters, alpha =0.05) cld_df <-as.data.frame(cld_temp) cld_df$Target <-"VIPERIN" cld_df$label <-trimws(cld_df$.group) cld_df$treatment_group <-paste(cld_df$polyIC, cld_df$stress_type, sep ="_") all_treat_annotations <-rbind(all_treat_annotations, cld_df[, c("Target", "treatment_group", "label")])}# Calculate y positions if annotations existif(nrow(all_treat_annotations) >0) { y_pos_all <- delta_Cq_df %>%group_by(Target, treatment_group) %>%summarise(max_y =max(delta_Cq, na.rm =TRUE), .groups ="drop")# Calculate data range for each gene to use proportional offset y_range_all <- delta_Cq_df %>%group_by(Target) %>%summarise(y_range =max(delta_Cq, na.rm =TRUE) -min(delta_Cq, na.rm =TRUE), .groups ="drop") all_treat_annotations <- all_treat_annotations %>%left_join(y_pos_all, by =c("Target", "treatment_group")) %>%left_join(y_range_all, by ="Target") %>%mutate(y_pos = max_y + y_range *0.08) # 8% of data range above max}# Create plotp <- delta_Cq_df %>%ggplot(aes(x = treatment_group, y = delta_Cq, fill = polyIC)) +geom_boxplot() +facet_wrap(~Target, scales ="free_y", ncol =2) +scale_fill_manual(values =c("No_PolyIC"="darkgray", "PolyIC"="salmon")) +scale_y_continuous(expand =expansion(mult =c(0.05, 0.15))) +# Extra space at top for annotationstheme_bw() +labs(title ="Delta Cq Across All Treatment Groups",x ="Treatment Group",y ="Delta Cq",fill ="PolyIC" ) +theme(axis.text.x =element_text(angle =45, hjust =1))# Add annotations if they existif(nrow(all_treat_annotations) >0) { p <- p +geom_text(data = all_treat_annotations,aes(x = treatment_group, y = y_pos, label = label),inherit.aes =FALSE, size =4, vjust =0, color ="darkorange", fontface ="bold") +labs(subtitle ="Letters show statistical groupings (p ≤ 0.05). Groups sharing a letter are NOT significantly different from each other",caption ="Compact Letter Display shown for genes with significant ANOVA effects. See ANOVA Models section for detailed statistics.")}print(p)
Delta Delta Cq and Fold Change Analysis
Calculate delta delta Cq for each comparison
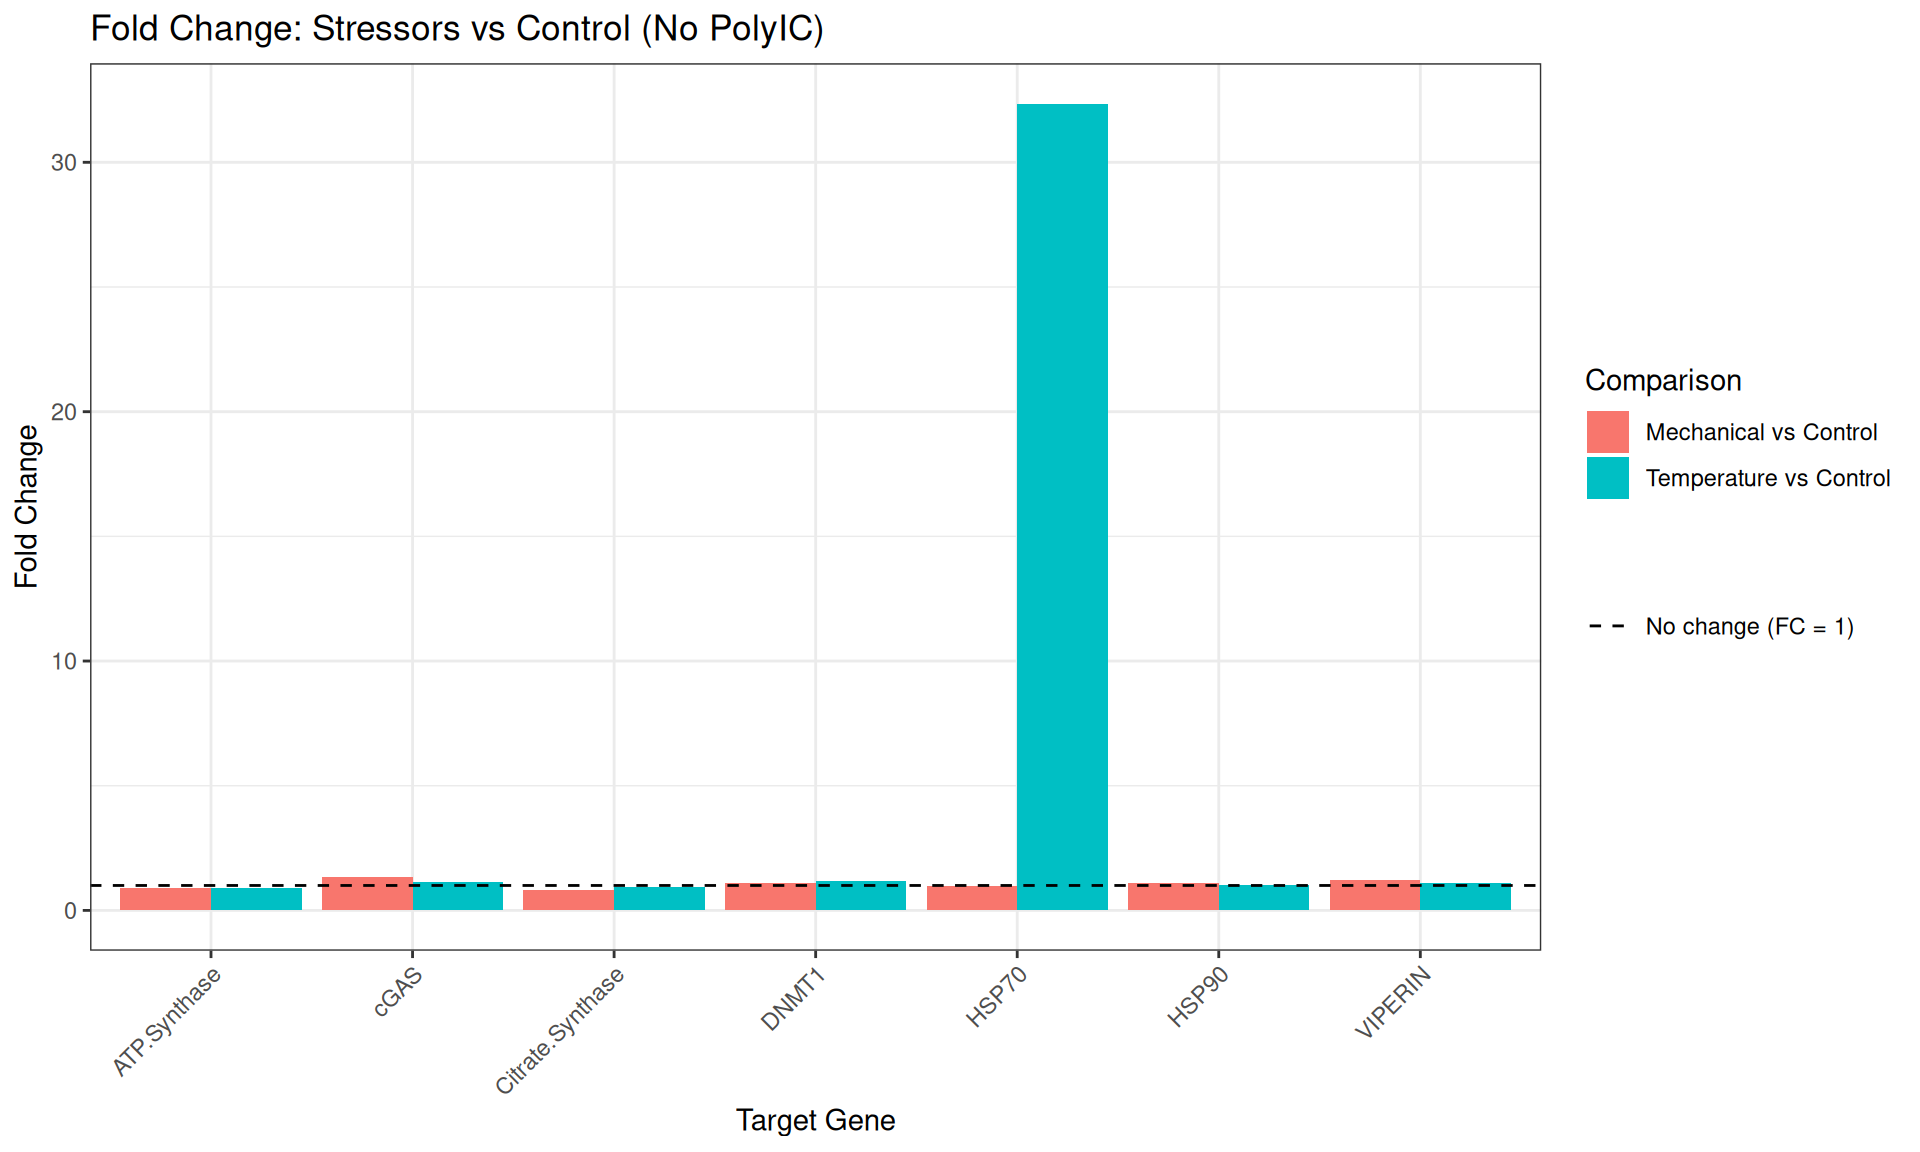
Comparison 1: Stressors vs Control (No PolyIC)
Code
# Calculate delta delta Cq for Temperature vs Control (No PolyIC)delta_delta_temp_no_polyIC <- no_polyIC_data %>%group_by(Target) %>%summarise(mean_control =mean(delta_Cq[stress_type =="Control"], na.rm =TRUE),mean_temp =mean(delta_Cq[stress_type =="Temperature"], na.rm =TRUE),delta_delta_Cq = mean_temp - mean_control,fold_change =2^(-delta_delta_Cq),.groups ='drop' )print("Temperature vs Control (No PolyIC):")print(delta_delta_temp_no_polyIC)# Calculate delta delta Cq for Mechanical vs Control (No PolyIC)delta_delta_mech_no_polyIC <- no_polyIC_data %>%group_by(Target) %>%summarise(mean_control =mean(delta_Cq[stress_type =="Control"], na.rm =TRUE),mean_mech =mean(delta_Cq[stress_type =="Mechanical"], na.rm =TRUE),delta_delta_Cq = mean_mech - mean_control,fold_change =2^(-delta_delta_Cq),.groups ='drop' )print("Mechanical vs Control (No PolyIC):")print(delta_delta_mech_no_polyIC)
# Combine temperature and mechanical comparisonsfold_change_no_polyIC <-bind_rows( delta_delta_temp_no_polyIC %>%mutate(comparison ="Temperature vs Control"), delta_delta_mech_no_polyIC %>%mutate(comparison ="Mechanical vs Control"))fold_change_no_polyIC %>%ggplot(aes(x = Target, y = fold_change, fill = comparison)) +geom_bar(stat ="identity", position ="dodge") +geom_hline(aes(yintercept =1, linetype ="No change (FC = 1)"), color ="black") +scale_linetype_manual(name ="", values =c("No change (FC = 1)"="dashed")) +theme_bw() +labs(title ="Fold Change: Stressors vs Control (No PolyIC)",x ="Target Gene",y ="Fold Change",fill ="Comparison" ) +theme(axis.text.x =element_text(angle =45, hjust =1))
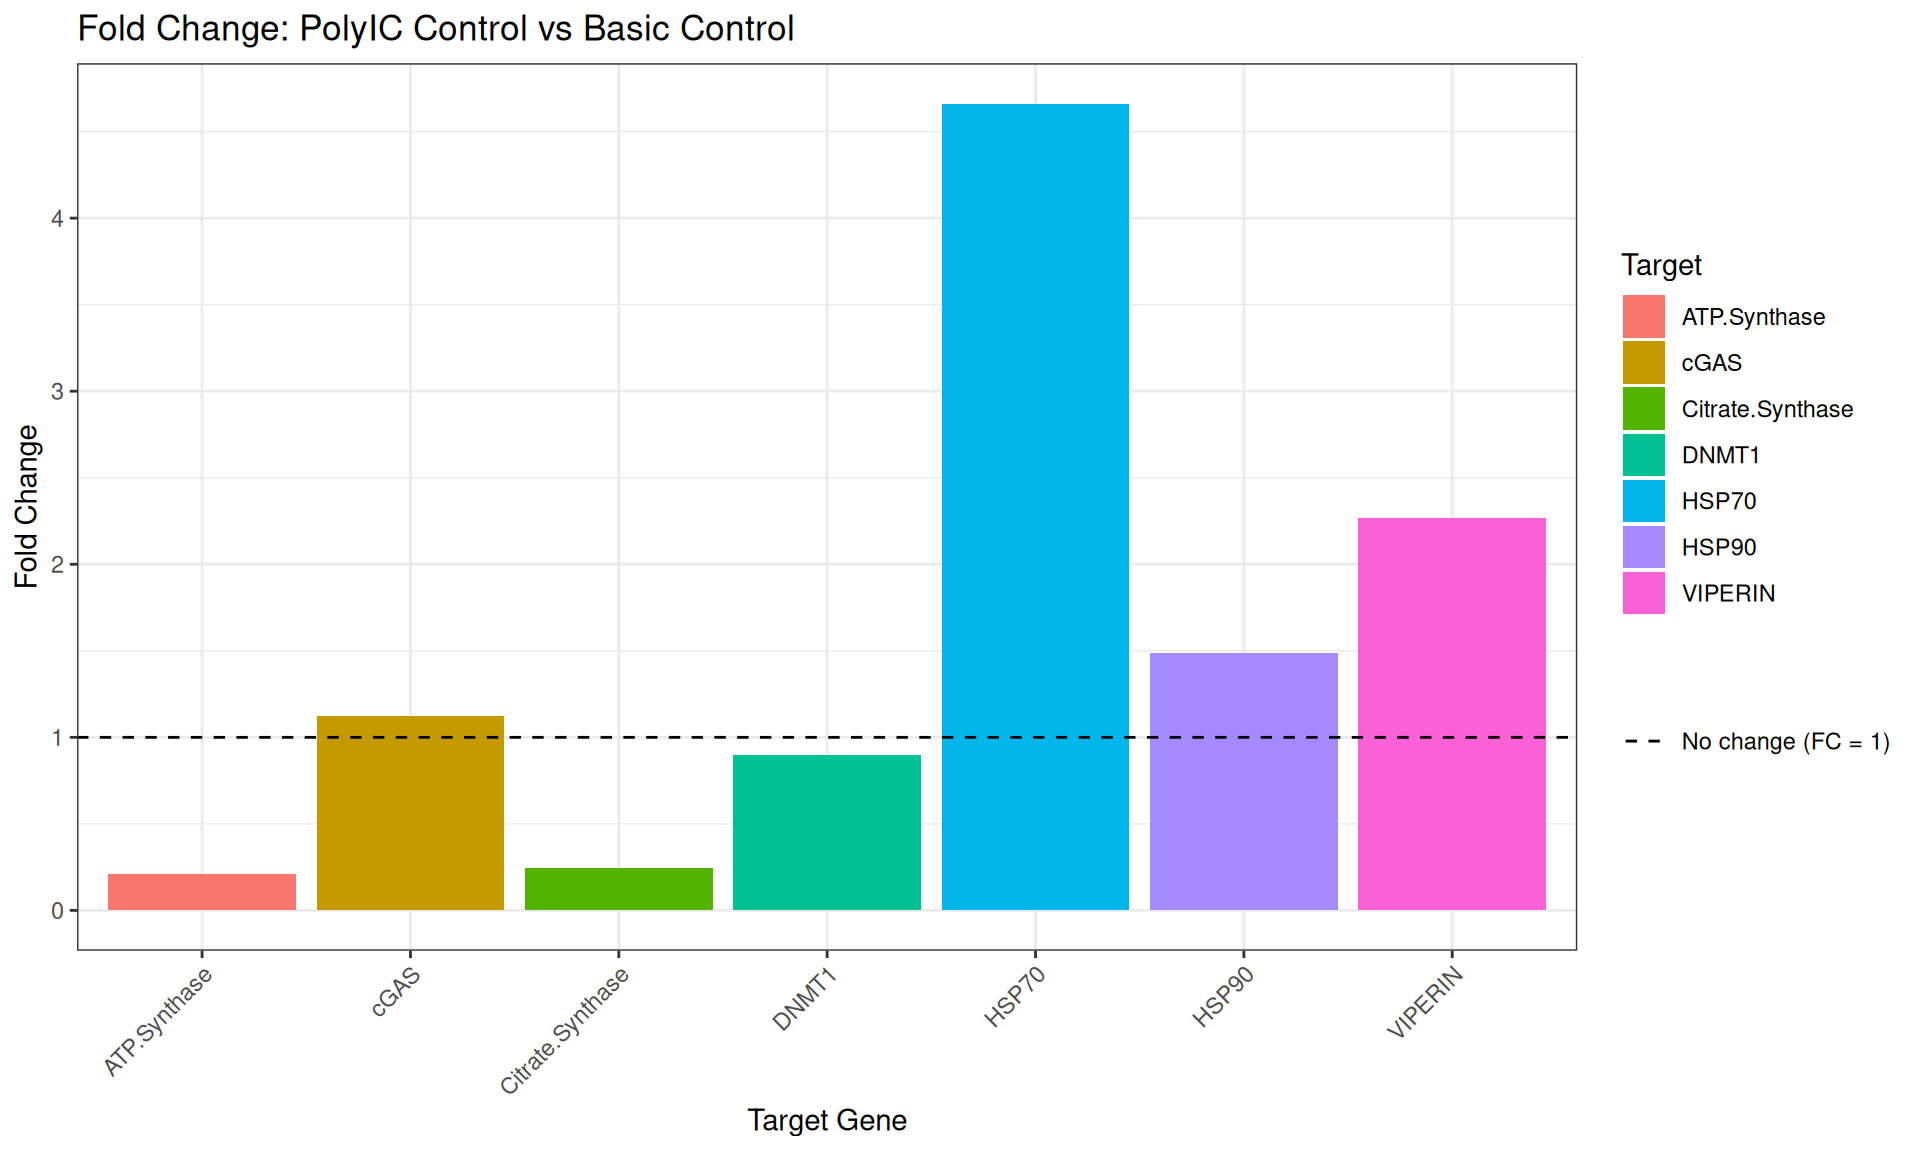
PolyIC Control vs Basic Control
Code
delta_delta_polyIC_control %>%ggplot(aes(x = Target, y = fold_change, fill = Target)) +geom_bar(stat ="identity") +geom_hline(aes(yintercept =1, linetype ="No change (FC = 1)"), color ="black") +scale_linetype_manual(name ="", values =c("No change (FC = 1)"="dashed")) +theme_bw() +labs(title ="Fold Change: PolyIC Control vs Basic Control",x ="Target Gene",y ="Fold Change" ) +theme(axis.text.x =element_text(angle =45, hjust =1))
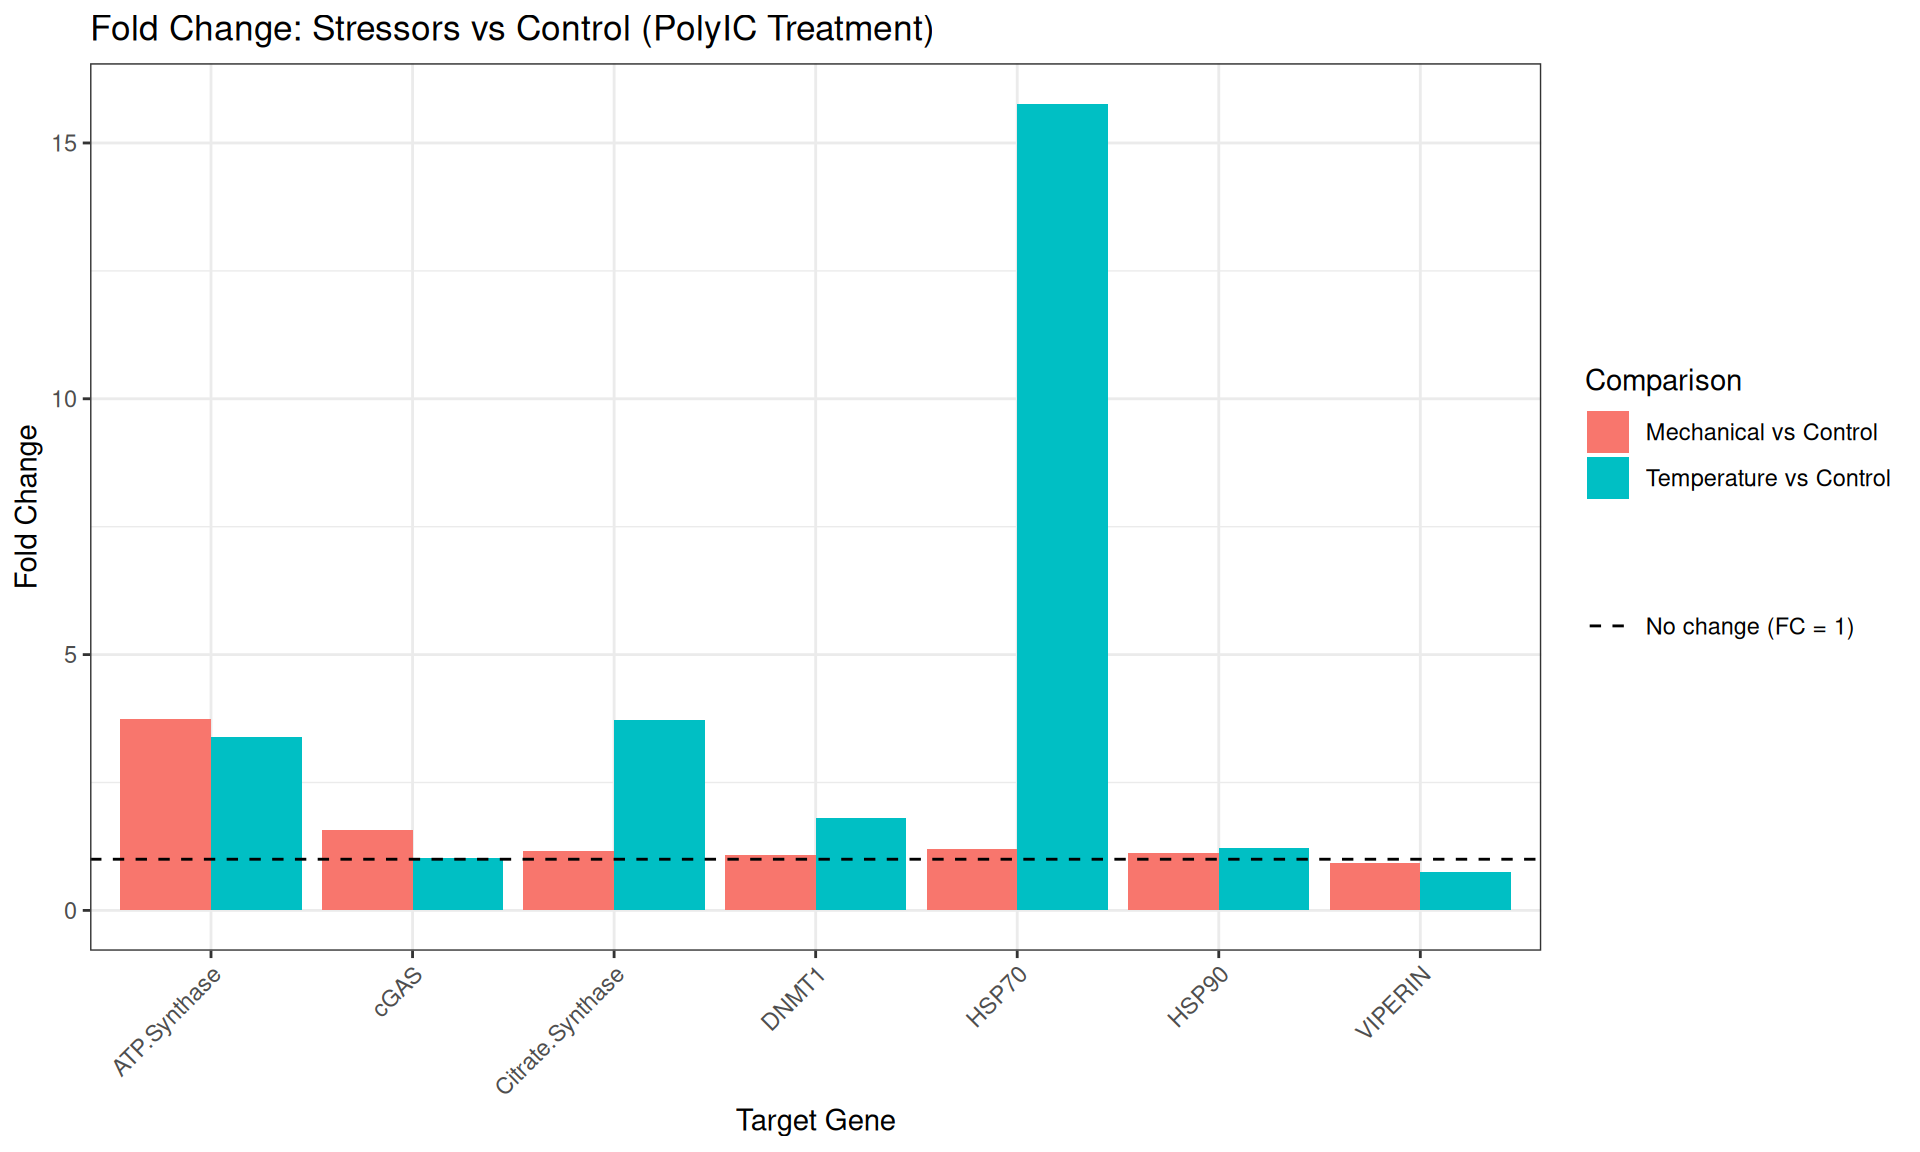
PolyIC: Stressors vs Control
Code
# Combine temperature and mechanical comparisons for PolyICfold_change_polyIC <-bind_rows( delta_delta_temp_polyIC %>%mutate(comparison ="Temperature vs Control"), delta_delta_mech_polyIC %>%mutate(comparison ="Mechanical vs Control"))fold_change_polyIC %>%ggplot(aes(x = Target, y = fold_change, fill = comparison)) +geom_bar(stat ="identity", position ="dodge") +geom_hline(aes(yintercept =1, linetype ="No change (FC = 1)"), color ="black") +scale_linetype_manual(name ="", values =c("No change (FC = 1)"="dashed")) +theme_bw() +labs(title ="Fold Change: Stressors vs Control (PolyIC Treatment)",x ="Target Gene",y ="Fold Change",fill ="Comparison" ) +theme(axis.text.x =element_text(angle =45, hjust =1))
ANOVA Results and Diagnostics
Run ANOVA models to test for effects of PolyIC treatment and stress type on delta Cq values for each target gene.
Note: ANOVA models were created in the Statistical Comparisons section above. This section provides detailed assumption checks and interpretations for each gene.
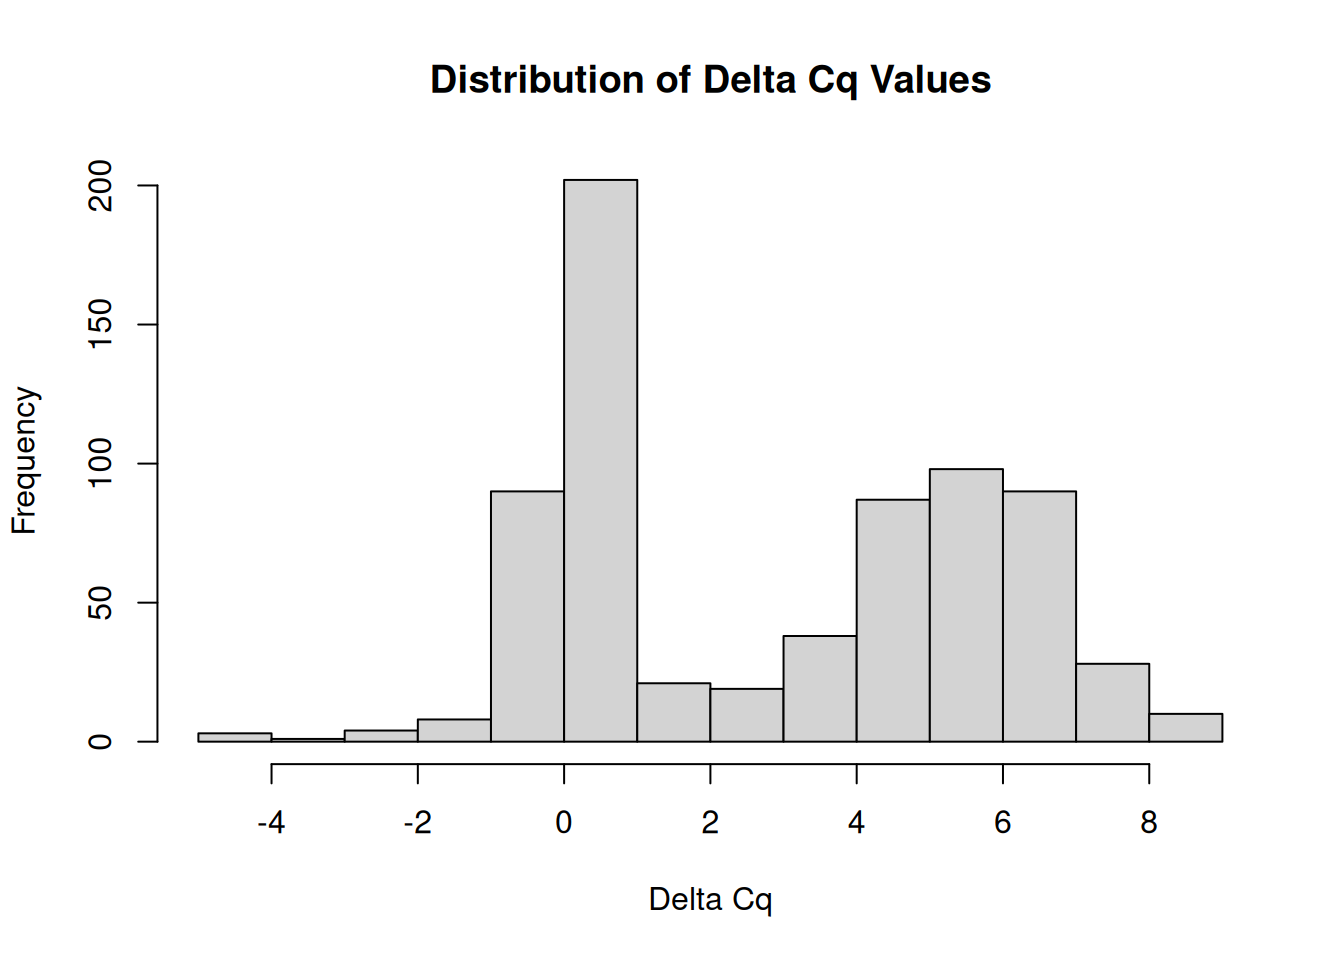
Data distribution check
ANOVA assumes that data (or residuals) are approximately normally distributed. This histogram provides a quick visual check of the overall delta Cq distribution across all samples and targets.
What to look for: - Bell-shaped curve: Indicates roughly normal distribution, supporting ANOVA use - Skewness: Strong left or right skew may violate normality assumptions - Outliers: Extreme values far from the main distribution - Multimodal: Multiple peaks may indicate distinct subpopulations
While this shows the overall distribution, we’ll check normality of residuals for each gene-specific model using QQ plots below.
Code
hist(delta_Cq_df$delta_Cq, main ="Distribution of Delta Cq Values", xlab ="Delta Cq")
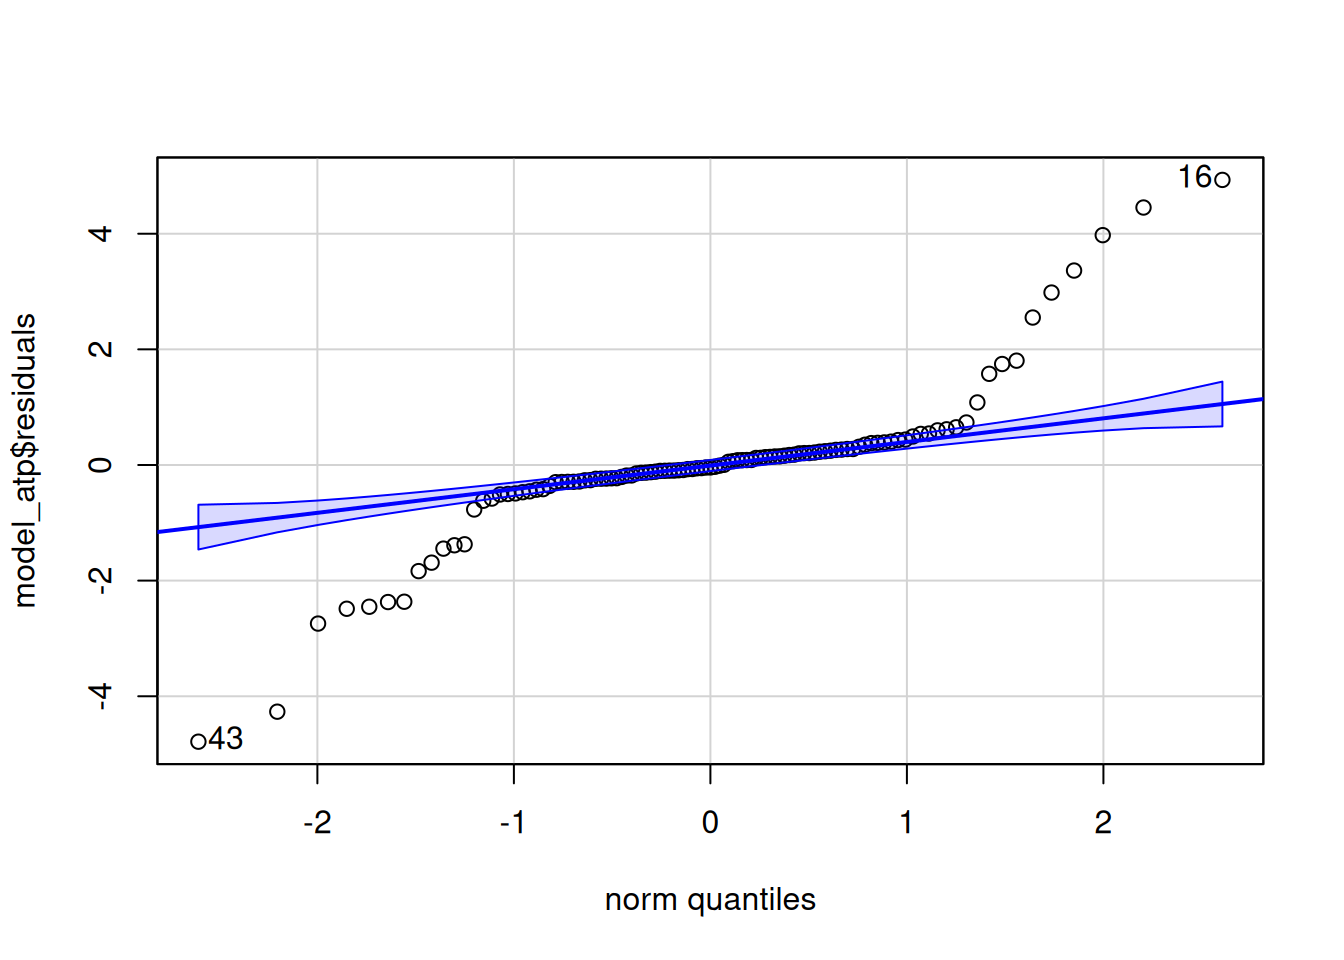
ATP Synthase
ATP synthase is an enzyme complex that functions to synthesize adenosine triphosphate (ATP) from adenosine diphosphate (ADP) and inorganic phosphate (Pi), essentially generating the cell’s primary energy currency by harnessing the energy from a proton gradient across a membrane.
Levene's Test for Homogeneity of Variance (center = median)
       Df F value    Pr(>F)
group   5  18.846 2.899e-13 ***
      103
---
Signif. codes:  0 '***' 0.001 '**' 0.01 '*' 0.05 '.' 0.1 ' ' 1
 contrast                                     estimate    SE  df t.ratio
 No_PolyIC Control - PolyIC Control           -2.25679 0.447 103  -5.044
 No_PolyIC Control - No_PolyIC Mechanical     -0.15123 0.429 103  -0.353
 No_PolyIC Control - PolyIC Mechanical        -0.35618 0.495 103  -0.719
 No_PolyIC Control - No_PolyIC Temperature    -0.14360 0.429 103  -0.335
 No_PolyIC Control - PolyIC Temperature       -0.49388 0.429 103  -1.151
 PolyIC Control - No_PolyIC Mechanical         2.10556 0.447 103   4.706
 PolyIC Control - PolyIC Mechanical            1.90061 0.511 103   3.717
 PolyIC Control - No_PolyIC Temperature        2.11319 0.447 103   4.723
 PolyIC Control - PolyIC Temperature           1.76291 0.447 103   3.940
 No_PolyIC Mechanical - PolyIC Mechanical     -0.20495 0.495 103  -0.414
 No_PolyIC Mechanical - No_PolyIC Temperature  0.00763 0.429 103   0.018
 No_PolyIC Mechanical - PolyIC Temperature    -0.34265 0.429 103  -0.799
 PolyIC Mechanical - No_PolyIC Temperature     0.21258 0.495 103   0.429
 PolyIC Mechanical - PolyIC Temperature       -0.13770 0.495 103  -0.278
 No_PolyIC Temperature - PolyIC Temperature   -0.35028 0.429 103  -0.817
 p.value
 <0.0001
  0.9993
  0.9792
  0.9994
  0.8584
  0.0001
  0.0043
  0.0001
  0.0020
  0.9984
  1.0000
  0.9671
  0.9981
  0.9998
  0.9639

P value adjustment: tukey method for comparing a family of 6 estimates

**ATP Synthase - Pairwise Contrast Summary:**

Significant contrasts (p ≤ 0.05):
- No_PolyIC Control - PolyIC Control (p = 0 )
- PolyIC Control - No_PolyIC Mechanical (p = 1e-04 )
- PolyIC Control - PolyIC Mechanical (p = 0.0043 )
- PolyIC Control - No_PolyIC Temperature (p = 1e-04 )
- PolyIC Control - PolyIC Temperature (p = 0.002 )
ATP Synthase ANOVA Interpretation
Code
anova_results <-summary(model_atp)[[1]]# Fix: Trim whitespace from rownamesrownames(anova_results) <-trimws(rownames(anova_results))levene_results <-leveneTest(model_atp$residuals ~ polyIC * stress_type, data = delta_Cq_df %>%filter(Target =="ATP.Synthase"))cat("**ATP Synthase ANOVA Results:**\n\n")cat("This ANOVA evaluates whether PolyIC treatment and/or stress type affect ATP Synthase expression (delta Cq).\n\n")cat("**Treatment Effects (ANOVA):**\n\n")# Check main effects and interactionif(anova_results["polyIC", "Pr(>F)"] <0.05) {cat("- **PolyIC effect**: SIGNIFICANT (p =", round(anova_results["polyIC", "Pr(>F)"], 4), ")\n")} else {cat("- **PolyIC effect**: Not significant (p =", round(anova_results["polyIC", "Pr(>F)"], 4), ")\n")}if(anova_results["stress_type", "Pr(>F)"] <0.05) {cat("- **Stress type effect**: SIGNIFICANT (p =", round(anova_results["stress_type", "Pr(>F)"], 4), ")\n")} else {cat("- **Stress type effect**: Not significant (p =", round(anova_results["stress_type", "Pr(>F)"], 4), ")\n")}if(anova_results["polyIC:stress_type", "Pr(>F)"] <0.05) {cat("- **PolyIC × Stress interaction**: SIGNIFICANT (p =", round(anova_results["polyIC:stress_type", "Pr(>F)"], 4), ")\n")cat(" → The effect of stress depends on PolyIC treatment status.\n")} else {cat("- **PolyIC × Stress interaction**: Not significant (p =", round(anova_results["polyIC:stress_type", "Pr(>F)"], 4), ")\n")}cat("\n**Assumption Checks:**\n\n")# Check Levene's testlevene_p <- levene_results$`Pr(>F)`[1]if(levene_p >0.05) {cat("- **Levene's Test** (homogeneity of variance): PASSED (p =", round(levene_p, 4), ") ✓\n")cat(" → Variances are equal across groups; ANOVA is appropriate.\n")} else {cat("- **Levene's Test** (homogeneity of variance): FAILED (p =", round(levene_p, 4), ") ⚠️\n")cat(" → Variances differ across groups; ANOVA results should be interpreted with caution.\n")}
**ATP Synthase ANOVA Results:**

This ANOVA evaluates whether PolyIC treatment and/or stress type affect ATP Synthase expression (delta Cq).

**Treatment Effects (ANOVA):**

- **PolyIC effect**: SIGNIFICANT (p = 3e-04 )
- **Stress type effect**: SIGNIFICANT (p = 0.0286 )
- **PolyIC × Stress interaction**: SIGNIFICANT (p = 0.0025 )
  → The effect of stress depends on PolyIC treatment status.

**Assumption Checks:**

- **Levene's Test** (homogeneity of variance): FAILED (p = 0 ) ⚠️
  → Variances differ across groups; ANOVA results should be interpreted with caution.
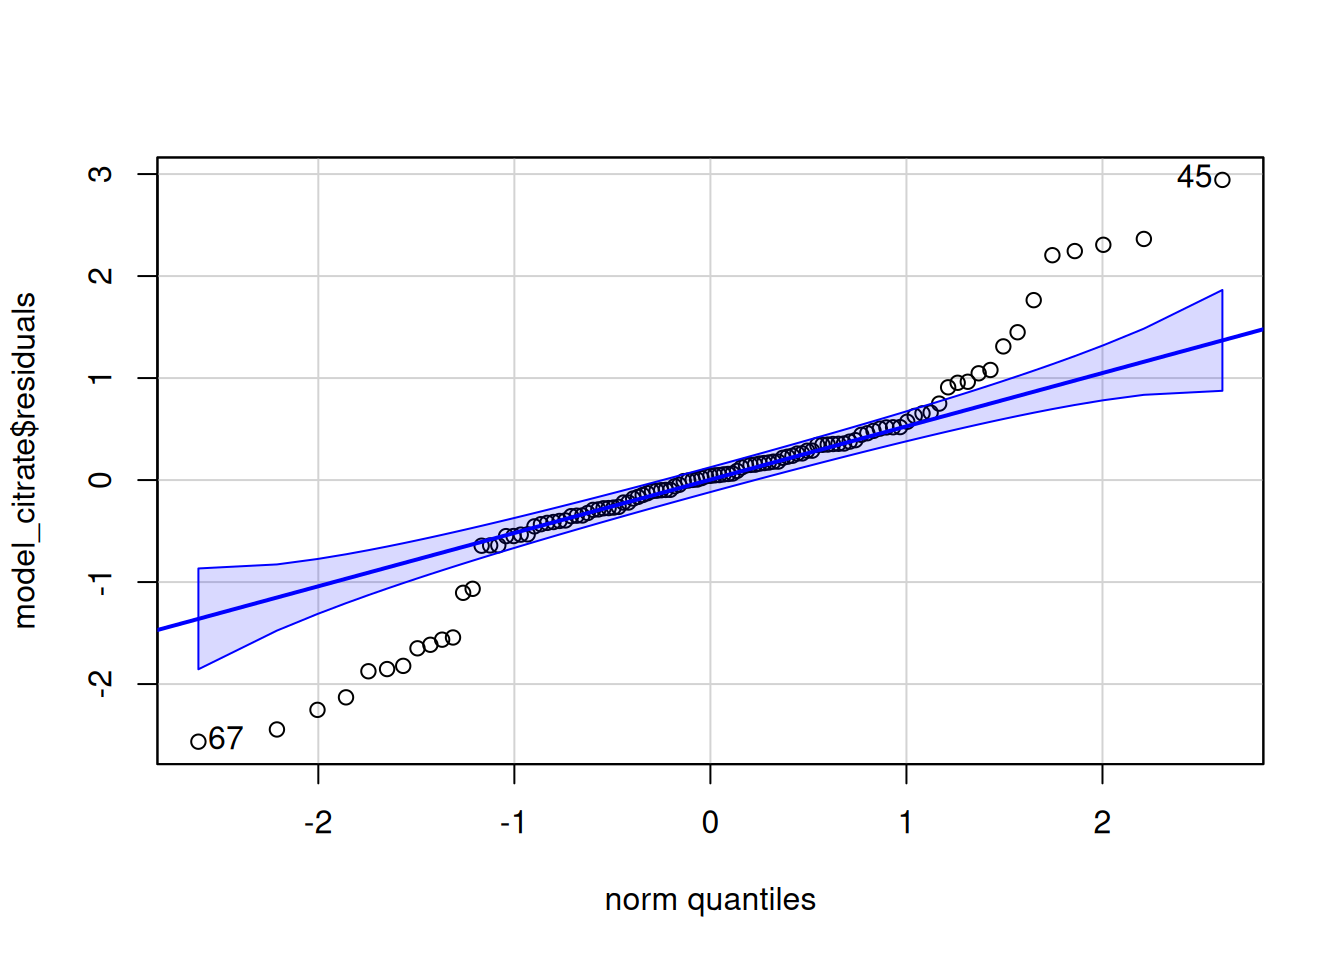
Citrate Synthase
Citrate synthase is important for energy production in the TCA cycle and is linked to the electron transport chain. It is also used as an enzyme marker for intact mitochondria.
Levene's Test for Homogeneity of Variance (center = median)
       Df F value   Pr(>F)
group   5  23.346 1.05e-15 ***
      105
---
Signif. codes:  0 '***' 0.001 '**' 0.01 '*' 0.05 '.' 0.1 ' ' 1
 contrast                                     estimate    SE  df t.ratio
 No_PolyIC Control - PolyIC Control            -2.0155 0.312 105  -6.470
 No_PolyIC Control - No_PolyIC Mechanical      -0.2950 0.303 105  -0.973
 No_PolyIC Control - PolyIC Mechanical         -1.7910 0.342 105  -5.243
 No_PolyIC Control - No_PolyIC Temperature     -0.1012 0.303 105  -0.334
 No_PolyIC Control - PolyIC Temperature        -0.1179 0.303 105  -0.389
 PolyIC Control - No_PolyIC Mechanical          1.7206 0.312 105   5.523
 PolyIC Control - PolyIC Mechanical             0.2245 0.349 105   0.643
 PolyIC Control - No_PolyIC Temperature         1.9143 0.312 105   6.145
 PolyIC Control - PolyIC Temperature            1.8976 0.312 105   6.092
 No_PolyIC Mechanical - PolyIC Mechanical      -1.4961 0.342 105  -4.380
 No_PolyIC Mechanical - No_PolyIC Temperature   0.1937 0.303 105   0.639
 No_PolyIC Mechanical - PolyIC Temperature      0.1770 0.303 105   0.584
 PolyIC Mechanical - No_PolyIC Temperature      1.6898 0.342 105   4.947
 PolyIC Mechanical - PolyIC Temperature         1.6731 0.342 105   4.898
 No_PolyIC Temperature - PolyIC Temperature    -0.0167 0.303 105  -0.055
 p.value
 <0.0001
  0.9256
 <0.0001
  0.9994
  0.9988
 <0.0001
  0.9874
 <0.0001
 <0.0001
  0.0004
  0.9878
  0.9919
 <0.0001
 <0.0001
  1.0000

P value adjustment: tukey method for comparing a family of 6 estimates

**Citrate Synthase - Pairwise Contrast Summary:**

Significant contrasts (p ≤ 0.05):
- No_PolyIC Control - PolyIC Control (p = 0 )
- No_PolyIC Control - PolyIC Mechanical (p = 0 )
- PolyIC Control - No_PolyIC Mechanical (p = 0 )
- PolyIC Control - No_PolyIC Temperature (p = 0 )
- PolyIC Control - PolyIC Temperature (p = 0 )
- No_PolyIC Mechanical - PolyIC Mechanical (p = 4e-04 )
- PolyIC Mechanical - No_PolyIC Temperature (p = 0 )
- PolyIC Mechanical - PolyIC Temperature (p = 1e-04 )
Citrate Synthase ANOVA Interpretation
Code
anova_results <-summary(model_citrate)[[1]]# Fix: Trim whitespace from rownamesrownames(anova_results) <-trimws(rownames(anova_results))levene_results <-leveneTest(model_citrate$residuals ~ polyIC * stress_type, data = delta_Cq_df %>%filter(Target =="Citrate.Synthase"))cat("**Citrate Synthase ANOVA Results:**\n\n")cat("This ANOVA evaluates whether PolyIC treatment and/or stress type affect Citrate Synthase expression (delta Cq).\n\n")cat("**Treatment Effects (ANOVA):**\n\n")if(anova_results["polyIC", "Pr(>F)"] <0.05) {cat("- **PolyIC effect**: SIGNIFICANT (p =", round(anova_results["polyIC", "Pr(>F)"], 4), ")\n")} else {cat("- **PolyIC effect**: Not significant (p =", round(anova_results["polyIC", "Pr(>F)"], 4), ")\n")}if(anova_results["stress_type", "Pr(>F)"] <0.05) {cat("- **Stress type effect**: SIGNIFICANT (p =", round(anova_results["stress_type", "Pr(>F)"], 4), ")\n")} else {cat("- **Stress type effect**: Not significant (p =", round(anova_results["stress_type", "Pr(>F)"], 4), ")\n")}if(anova_results["polyIC:stress_type", "Pr(>F)"] <0.05) {cat("- **PolyIC × Stress interaction**: SIGNIFICANT (p =", round(anova_results["polyIC:stress_type", "Pr(>F)"], 4), ")\n")cat(" → The effect of stress depends on PolyIC treatment status.\n")} else {cat("- **PolyIC × Stress interaction**: Not significant (p =", round(anova_results["polyIC:stress_type", "Pr(>F)"], 4), ")\n")}cat("\n**Assumption Checks:**\n\n")levene_p <- levene_results$`Pr(>F)`[1]if(levene_p >0.05) {cat("- **Levene's Test** (homogeneity of variance): PASSED (p =", round(levene_p, 4), ") ✓\n")cat(" → Variances are equal across groups; ANOVA is appropriate.\n")} else {cat("- **Levene's Test** (homogeneity of variance): FAILED (p =", round(levene_p, 4), ") ⚠️\n")cat(" → Variances differ across groups; ANOVA results should be interpreted with caution.\n")}
**Citrate Synthase ANOVA Results:**

This ANOVA evaluates whether PolyIC treatment and/or stress type affect Citrate Synthase expression (delta Cq).

**Treatment Effects (ANOVA):**

- **PolyIC effect**: SIGNIFICANT (p = 0 )
- **Stress type effect**: SIGNIFICANT (p = 1e-04 )
- **PolyIC × Stress interaction**: SIGNIFICANT (p = 0 )
  → The effect of stress depends on PolyIC treatment status.

**Assumption Checks:**

- **Levene's Test** (homogeneity of variance): FAILED (p = 0 ) ⚠️
  → Variances differ across groups; ANOVA results should be interpreted with caution.
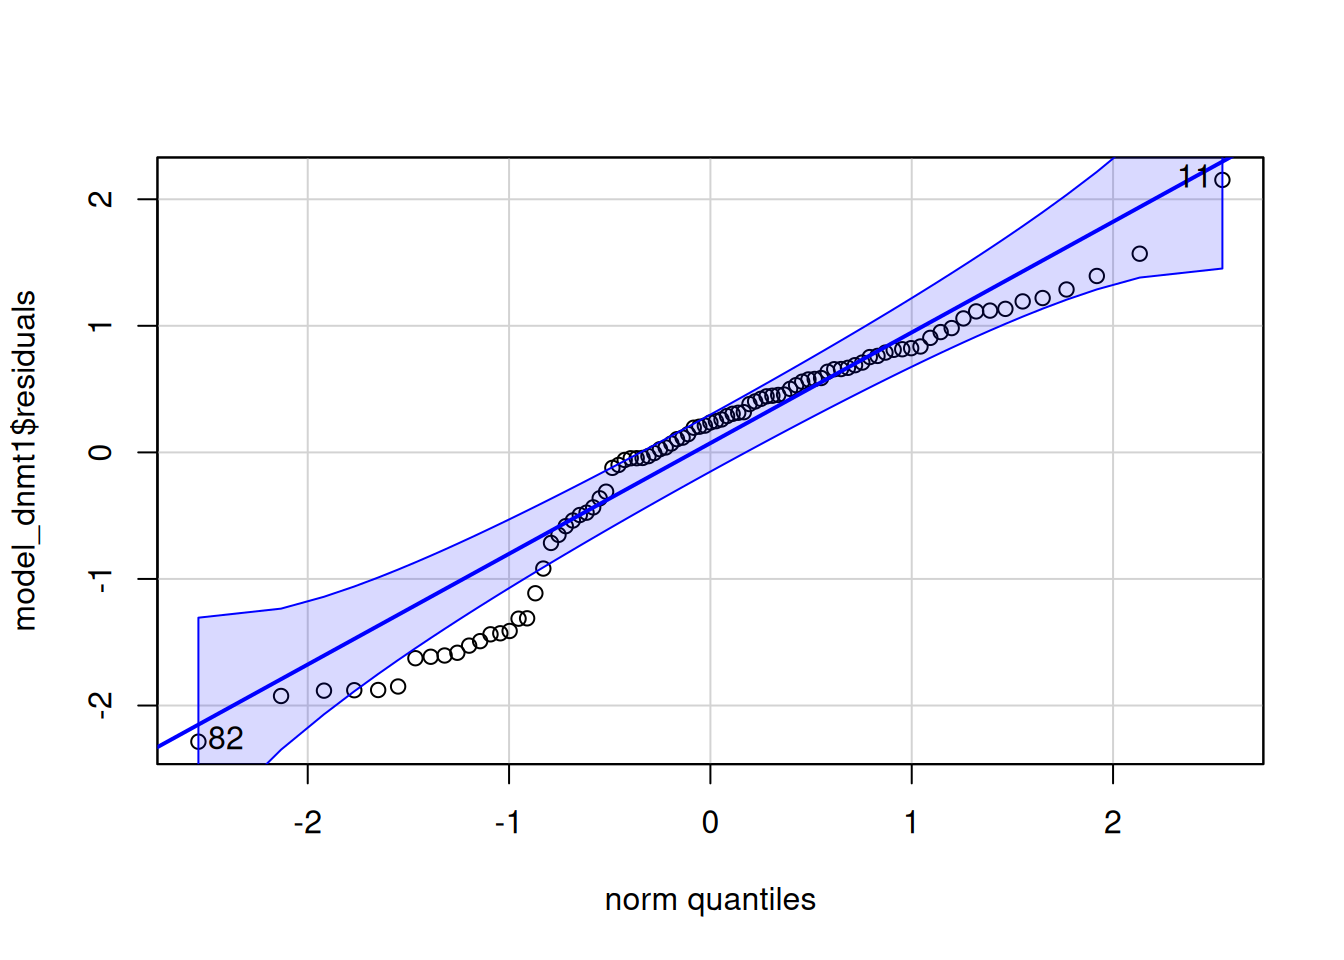
DNMT1
The DNMT1 gene provides instructions for making an enzyme called DNA methyltransferase 1. This enzyme is involved in DNA methylation, which is the addition of methyl groups, consisting of one carbon atom and three hydrogen atoms, to DNA molecules.
Levene's Test for Homogeneity of Variance (center = median)
      Df F value Pr(>F)
group  5  0.7104 0.6172
      85
No significant effects found; post-hoc tests not performed.
DNMT1 ANOVA Interpretation
Code
anova_results <-summary(model_dnmt1)[[1]]# Fix: Trim whitespace from rownamesrownames(anova_results) <-trimws(rownames(anova_results))levene_results <-leveneTest(model_dnmt1$residuals ~ polyIC * stress_type, data = delta_Cq_df %>%filter(Target =="DNMT1"))cat("**DNMT1 ANOVA Results:**\n\n")cat("This ANOVA evaluates whether PolyIC treatment and/or stress type affect DNMT1 expression (delta Cq).\n\n")cat("**Treatment Effects (ANOVA):**\n\n")if(anova_results["polyIC", "Pr(>F)"] <0.05) {cat("- **PolyIC effect**: SIGNIFICANT (p =", round(anova_results["polyIC", "Pr(>F)"], 4), ")\n")} else {cat("- **PolyIC effect**: Not significant (p =", round(anova_results["polyIC", "Pr(>F)"], 4), ")\n")}if(anova_results["stress_type", "Pr(>F)"] <0.05) {cat("- **Stress type effect**: SIGNIFICANT (p =", round(anova_results["stress_type", "Pr(>F)"], 4), ")\n")} else {cat("- **Stress type effect**: Not significant (p =", round(anova_results["stress_type", "Pr(>F)"], 4), ")\n")}if(anova_results["polyIC:stress_type", "Pr(>F)"] <0.05) {cat("- **PolyIC × Stress interaction**: SIGNIFICANT (p =", round(anova_results["polyIC:stress_type", "Pr(>F)"], 4), ")\n")cat(" → The effect of stress depends on PolyIC treatment status.\n")} else {cat("- **PolyIC × Stress interaction**: Not significant (p =", round(anova_results["polyIC:stress_type", "Pr(>F)"], 4), ")\n")}cat("\n**Assumption Checks:**\n\n")levene_p <- levene_results$`Pr(>F)`[1]if(levene_p >0.05) {cat("- **Levene's Test** (homogeneity of variance): PASSED (p =", round(levene_p, 4), ") ✓\n")cat(" → Variances are equal across groups; ANOVA is appropriate.\n")} else {cat("- **Levene's Test** (homogeneity of variance): FAILED (p =", round(levene_p, 4), ") ⚠️\n")cat(" → Variances differ across groups; ANOVA results should be interpreted with caution.\n")}
**DNMT1 ANOVA Results:**

This ANOVA evaluates whether PolyIC treatment and/or stress type affect DNMT1 expression (delta Cq).

**Treatment Effects (ANOVA):**

- **PolyIC effect**: Not significant (p = 0.1934 )
- **Stress type effect**: Not significant (p = 0.1795 )
- **PolyIC × Stress interaction**: Not significant (p = 0.3988 )

**Assumption Checks:**

- **Levene's Test** (homogeneity of variance): PASSED (p = 0.6172 ) ✓
  → Variances are equal across groups; ANOVA is appropriate.
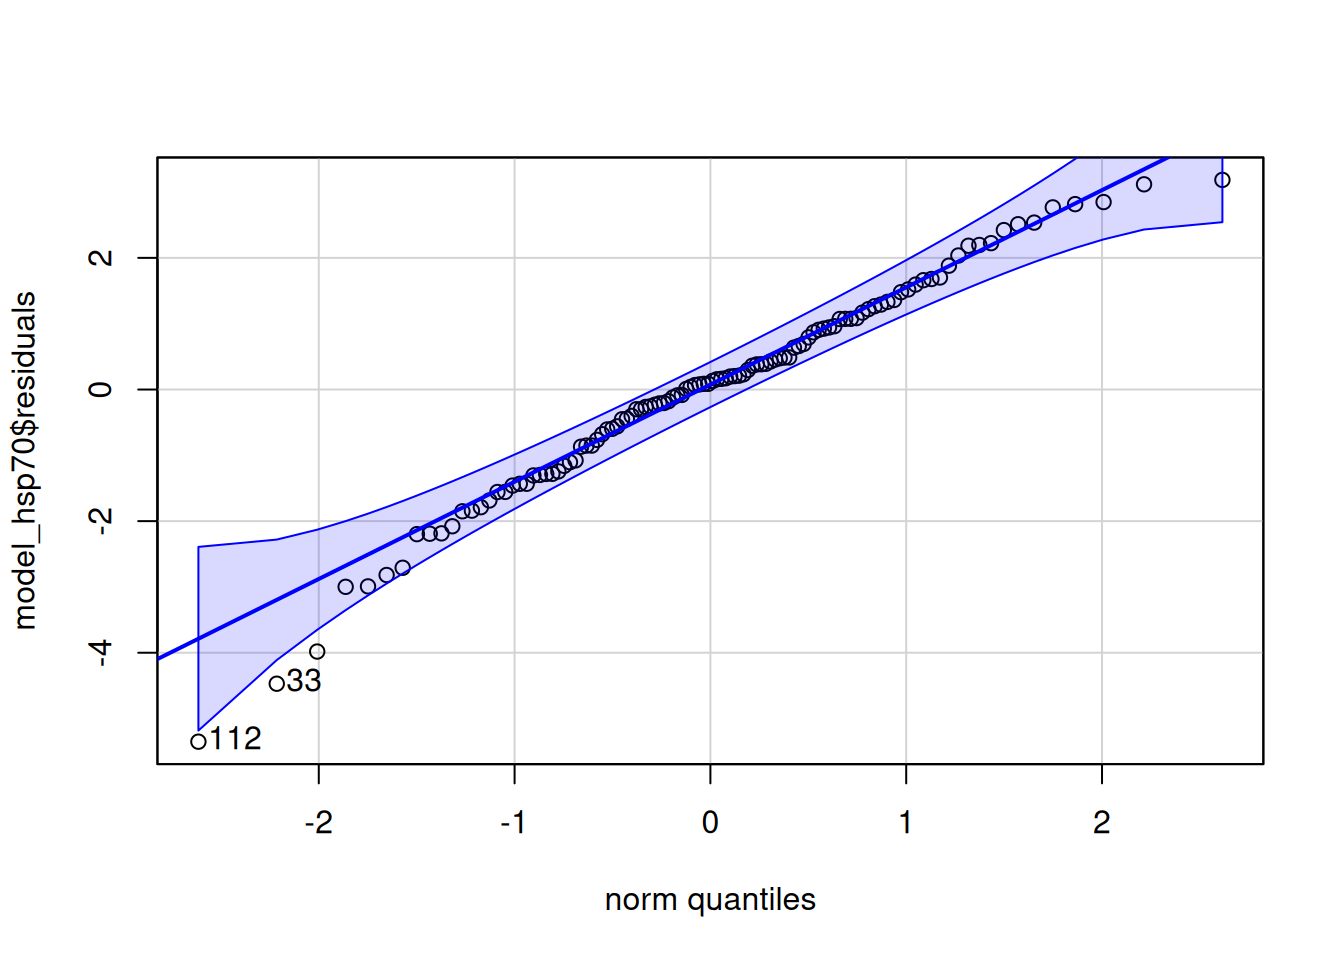
HSP70
Heat Shock Protein 70 (Hsp70) is a molecular chaperone that plays crucial roles in maintaining cellular protein homeostasis and protecting cells from stress.
Levene's Test for Homogeneity of Variance (center = median)
       Df F value Pr(>F)
group   5  0.5772 0.7174
      106
 contrast                                     estimate    SE  df t.ratio
 No_PolyIC Control - PolyIC Control            2.22096 0.528 106   4.204
 No_PolyIC Control - No_PolyIC Mechanical     -0.00376 0.514 106  -0.007
 No_PolyIC Control - PolyIC Mechanical         2.48756 0.567 106   4.391
 No_PolyIC Control - No_PolyIC Temperature     5.01595 0.514 106   9.756
 No_PolyIC Control - PolyIC Temperature        6.20008 0.514 106  12.059
 PolyIC Control - No_PolyIC Mechanical        -2.22472 0.528 106  -4.212
 PolyIC Control - PolyIC Mechanical            0.26660 0.579 106   0.460
 PolyIC Control - No_PolyIC Temperature        2.79500 0.528 106   5.291
 PolyIC Control - PolyIC Temperature           3.97913 0.528 106   7.533
 No_PolyIC Mechanical - PolyIC Mechanical      2.49132 0.567 106   4.397
 No_PolyIC Mechanical - No_PolyIC Temperature  5.01971 0.514 106   9.763
 No_PolyIC Mechanical - PolyIC Temperature     6.20385 0.514 106  12.066
 PolyIC Mechanical - No_PolyIC Temperature     2.52840 0.567 106   4.463
 PolyIC Mechanical - PolyIC Temperature        3.71253 0.567 106   6.553
 No_PolyIC Temperature - PolyIC Temperature    1.18413 0.514 106   2.303
 p.value
  0.0008
  1.0000
  0.0004
 <0.0001
 <0.0001
  0.0007
  0.9974
 <0.0001
 <0.0001
  0.0004
 <0.0001
 <0.0001
  0.0003
 <0.0001
  0.2021

P value adjustment: tukey method for comparing a family of 6 estimates

**HSP70 - Pairwise Contrast Summary:**

Significant contrasts (p ≤ 0.05):
- No_PolyIC Control - PolyIC Control (p = 8e-04 )
- No_PolyIC Control - PolyIC Mechanical (p = 4e-04 )
- No_PolyIC Control - No_PolyIC Temperature (p = 0 )
- No_PolyIC Control - PolyIC Temperature (p = 0 )
- PolyIC Control - No_PolyIC Mechanical (p = 7e-04 )
- PolyIC Control - No_PolyIC Temperature (p = 0 )
- PolyIC Control - PolyIC Temperature (p = 0 )
- No_PolyIC Mechanical - PolyIC Mechanical (p = 4e-04 )
- No_PolyIC Mechanical - No_PolyIC Temperature (p = 0 )
- No_PolyIC Mechanical - PolyIC Temperature (p = 0 )
- PolyIC Mechanical - No_PolyIC Temperature (p = 3e-04 )
- PolyIC Mechanical - PolyIC Temperature (p = 0 )
HSP70 ANOVA Interpretation
Code
anova_results <-summary(model_hsp70)[[1]]# Fix: Trim whitespace from rownamesrownames(anova_results) <-trimws(rownames(anova_results))levene_results <-leveneTest(model_hsp70$residuals ~ polyIC * stress_type, data = delta_Cq_df %>%filter(Target =="HSP70"))cat("**HSP70 ANOVA Results:**\n\n")cat("This ANOVA evaluates whether PolyIC treatment and/or stress type affect HSP70 expression (delta Cq).\n\n")cat("**Treatment Effects (ANOVA):**\n\n")if(anova_results["polyIC", "Pr(>F)"] <0.05) {cat("- **PolyIC effect**: SIGNIFICANT (p =", round(anova_results["polyIC", "Pr(>F)"], 4), ")\n")} else {cat("- **PolyIC effect**: Not significant (p =", round(anova_results["polyIC", "Pr(>F)"], 4), ")\n")}if(anova_results["stress_type", "Pr(>F)"] <0.05) {cat("- **Stress type effect**: SIGNIFICANT (p =", round(anova_results["stress_type", "Pr(>F)"], 4), ")\n")} else {cat("- **Stress type effect**: Not significant (p =", round(anova_results["stress_type", "Pr(>F)"], 4), ")\n")}if(anova_results["polyIC:stress_type", "Pr(>F)"] <0.05) {cat("- **PolyIC × Stress interaction**: SIGNIFICANT (p =", round(anova_results["polyIC:stress_type", "Pr(>F)"], 4), ")\n")cat(" → The effect of stress depends on PolyIC treatment status.\n")} else {cat("- **PolyIC × Stress interaction**: Not significant (p =", round(anova_results["polyIC:stress_type", "Pr(>F)"], 4), ")\n")}cat("\n**Assumption Checks:**\n\n")levene_p <- levene_results$`Pr(>F)`[1]if(levene_p >0.05) {cat("- **Levene's Test** (homogeneity of variance): PASSED (p =", round(levene_p, 4), ") ✓\n")cat(" → Variances are equal across groups; ANOVA is appropriate.\n")} else {cat("- **Levene's Test** (homogeneity of variance): FAILED (p =", round(levene_p, 4), ") ⚠️\n")cat(" → Variances differ across groups; ANOVA results should be interpreted with caution.\n")}
**HSP70 ANOVA Results:**

This ANOVA evaluates whether PolyIC treatment and/or stress type affect HSP70 expression (delta Cq).

**Treatment Effects (ANOVA):**

- **PolyIC effect**: SIGNIFICANT (p = 0 )
- **Stress type effect**: SIGNIFICANT (p = 0 )
- **PolyIC × Stress interaction**: Not significant (p = 0.1886 )

**Assumption Checks:**

- **Levene's Test** (homogeneity of variance): PASSED (p = 0.7174 ) ✓
  → Variances are equal across groups; ANOVA is appropriate.
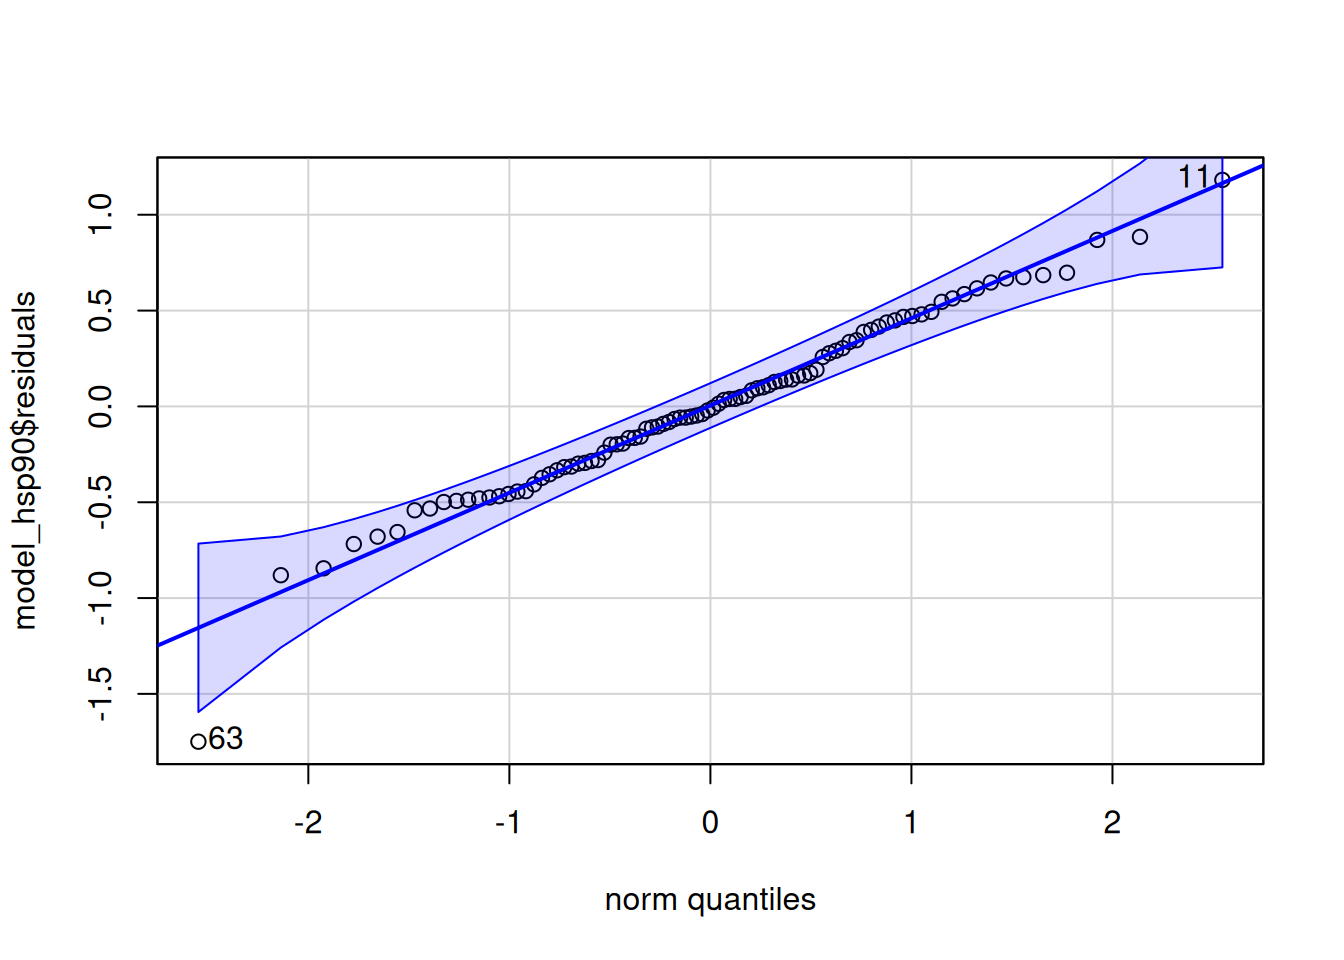
HSP90
Heat shock protein 90 (Hsp90) is a molecular chaperone that helps proteins fold, mature, and remain active. Hsp90 also helps regulate signaling networks and is involved in many cellular processes.
Levene's Test for Homogeneity of Variance (center = median)
      Df F value Pr(>F)
group  5  0.2428 0.9423
      86
 contrast                                     estimate    SE df t.ratio p.value
 No_PolyIC Control - PolyIC Control             0.5705 0.197 86   2.896  0.0525
 No_PolyIC Control - No_PolyIC Mechanical       0.1112 0.149 86   0.747  0.9753
 No_PolyIC Control - PolyIC Mechanical          0.7415 0.258 86   2.875  0.0555
 No_PolyIC Control - No_PolyIC Temperature      0.0306 0.149 86   0.205  0.9999
 No_PolyIC Control - PolyIC Temperature         0.8525 0.149 86   5.725 <0.0001
 PolyIC Control - No_PolyIC Mechanical         -0.4593 0.197 86  -2.331  0.1930
 PolyIC Control - PolyIC Mechanical             0.1710 0.288 86   0.593  0.9913
 PolyIC Control - No_PolyIC Temperature        -0.5399 0.197 86  -2.741  0.0777
 PolyIC Control - PolyIC Temperature            0.2820 0.197 86   1.432  0.7078
 No_PolyIC Mechanical - PolyIC Mechanical       0.6303 0.258 86   2.444  0.1531
 No_PolyIC Mechanical - No_PolyIC Temperature  -0.0806 0.149 86  -0.541  0.9943
 No_PolyIC Mechanical - PolyIC Temperature      0.7413 0.149 86   4.978 <0.0001
 PolyIC Mechanical - No_PolyIC Temperature     -0.7109 0.258 86  -2.756  0.0748
 PolyIC Mechanical - PolyIC Temperature         0.1110 0.258 86   0.430  0.9981
 No_PolyIC Temperature - PolyIC Temperature     0.8219 0.149 86   5.519 <0.0001

P value adjustment: tukey method for comparing a family of 6 estimates

**HSP90 - Pairwise Contrast Summary:**

Significant contrasts (p ≤ 0.05):
- No_PolyIC Control - PolyIC Temperature (p = 0 )
- No_PolyIC Mechanical - PolyIC Temperature (p = 0 )
- No_PolyIC Temperature - PolyIC Temperature (p = 0 )
HSP90 ANOVA Interpretation
Code
anova_results <-summary(model_hsp90)[[1]]# Fix: Trim whitespace from rownamesrownames(anova_results) <-trimws(rownames(anova_results))levene_results <-leveneTest(model_hsp90$residuals ~ polyIC * stress_type, data = delta_Cq_df %>%filter(Target =="HSP90"))cat("**HSP90 ANOVA Results:**\n\n")cat("This ANOVA evaluates whether PolyIC treatment and/or stress type affect HSP90 expression (delta Cq).\n\n")cat("**Treatment Effects (ANOVA):**\n\n")if(anova_results["polyIC", "Pr(>F)"] <0.05) {cat("- **PolyIC effect**: SIGNIFICANT (p =", round(anova_results["polyIC", "Pr(>F)"], 4), ")\n")} else {cat("- **PolyIC effect**: Not significant (p =", round(anova_results["polyIC", "Pr(>F)"], 4), ")\n")}if(anova_results["stress_type", "Pr(>F)"] <0.05) {cat("- **Stress type effect**: SIGNIFICANT (p =", round(anova_results["stress_type", "Pr(>F)"], 4), ")\n")} else {cat("- **Stress type effect**: Not significant (p =", round(anova_results["stress_type", "Pr(>F)"], 4), ")\n")}if(anova_results["polyIC:stress_type", "Pr(>F)"] <0.05) {cat("- **PolyIC × Stress interaction**: SIGNIFICANT (p =", round(anova_results["polyIC:stress_type", "Pr(>F)"], 4), ")\n")cat(" → The effect of stress depends on PolyIC treatment status.\n")} else {cat("- **PolyIC × Stress interaction**: Not significant (p =", round(anova_results["polyIC:stress_type", "Pr(>F)"], 4), ")\n")}cat("\n**Assumption Checks:**\n\n")levene_p <- levene_results$`Pr(>F)`[1]if(levene_p >0.05) {cat("- **Levene's Test** (homogeneity of variance): PASSED (p =", round(levene_p, 4), ") ✓\n")cat(" → Variances are equal across groups; ANOVA is appropriate.\n")} else {cat("- **Levene's Test** (homogeneity of variance): FAILED (p =", round(levene_p, 4), ") ⚠️\n")cat(" → Variances differ across groups; ANOVA results should be interpreted with caution.\n")}
**HSP90 ANOVA Results:**

This ANOVA evaluates whether PolyIC treatment and/or stress type affect HSP90 expression (delta Cq).

**Treatment Effects (ANOVA):**

- **PolyIC effect**: SIGNIFICANT (p = 0 )
- **Stress type effect**: Not significant (p = 0.4758 )
- **PolyIC × Stress interaction**: Not significant (p = 0.5618 )

**Assumption Checks:**

- **Levene's Test** (homogeneity of variance): PASSED (p = 0.9423 ) ✓
  → Variances are equal across groups; ANOVA is appropriate.
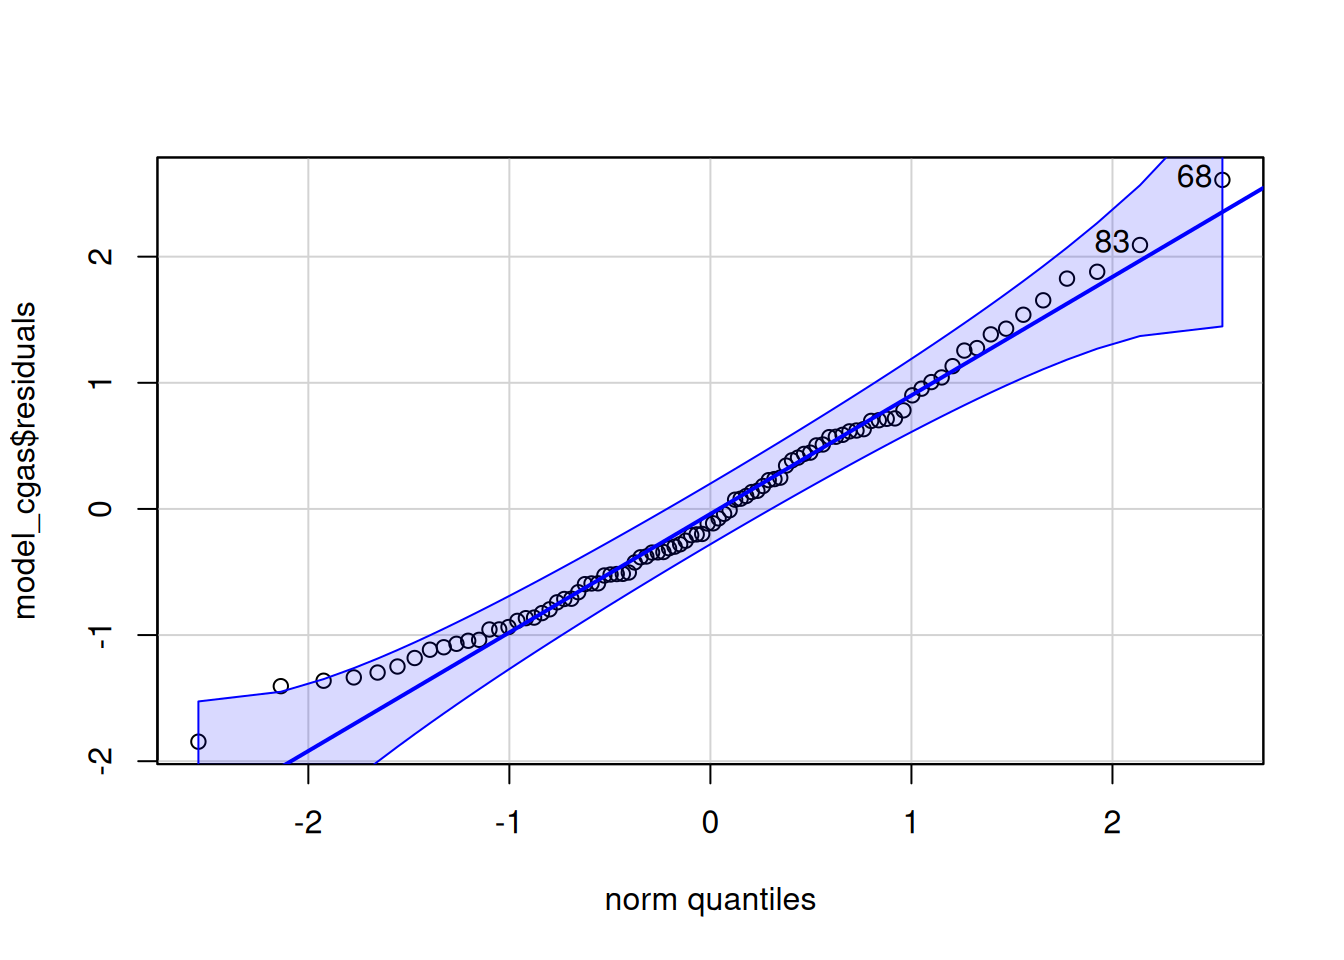
cGAS
The cGAS gene is involved in several processes, including cellular response to exogenous dsRNA, positive regulation of intracellular signal transduction, and regulation of defense response.
Levene's Test for Homogeneity of Variance (center = median)
      Df F value Pr(>F)
group  5  0.7847 0.5635
      86
No significant effects found; post-hoc tests not performed.
cGAS ANOVA Interpretation
Code
anova_results <-summary(model_cgas)[[1]]# Fix: Trim whitespace from rownamesrownames(anova_results) <-trimws(rownames(anova_results))levene_results <-leveneTest(model_cgas$residuals ~ polyIC * stress_type, data = delta_Cq_df %>%filter(Target =="cGAS"))cat("**cGAS ANOVA Results:**\n\n")cat("This ANOVA evaluates whether PolyIC treatment and/or stress type affect cGAS expression (delta Cq).\n\n")cat("**Treatment Effects (ANOVA):**\n\n")if(anova_results["polyIC", "Pr(>F)"] <0.05) {cat("- **PolyIC effect**: SIGNIFICANT (p =", round(anova_results["polyIC", "Pr(>F)"], 4), ")\n")} else {cat("- **PolyIC effect**: Not significant (p =", round(anova_results["polyIC", "Pr(>F)"], 4), ")\n")}if(anova_results["stress_type", "Pr(>F)"] <0.05) {cat("- **Stress type effect**: SIGNIFICANT (p =", round(anova_results["stress_type", "Pr(>F)"], 4), ")\n")} else {cat("- **Stress type effect**: Not significant (p =", round(anova_results["stress_type", "Pr(>F)"], 4), ")\n")}if(anova_results["polyIC:stress_type", "Pr(>F)"] <0.05) {cat("- **PolyIC × Stress interaction**: SIGNIFICANT (p =", round(anova_results["polyIC:stress_type", "Pr(>F)"], 4), ")\n")cat(" → The effect of stress depends on PolyIC treatment status.\n")} else {cat("- **PolyIC × Stress interaction**: Not significant (p =", round(anova_results["polyIC:stress_type", "Pr(>F)"], 4), ")\n")}cat("\n**Assumption Checks:**\n\n")levene_p <- levene_results$`Pr(>F)`[1]if(levene_p >0.05) {cat("- **Levene's Test** (homogeneity of variance): PASSED (p =", round(levene_p, 4), ") ✓\n")cat(" → Variances are equal across groups; ANOVA is appropriate.\n")} else {cat("- **Levene's Test** (homogeneity of variance): FAILED (p =", round(levene_p, 4), ") ⚠️\n")cat(" → Variances differ across groups; ANOVA results should be interpreted with caution.\n")}
**cGAS ANOVA Results:**

This ANOVA evaluates whether PolyIC treatment and/or stress type affect cGAS expression (delta Cq).

**Treatment Effects (ANOVA):**

- **PolyIC effect**: Not significant (p = 0.7486 )
- **Stress type effect**: Not significant (p = 0.1679 )
- **PolyIC × Stress interaction**: Not significant (p = 0.8312 )

**Assumption Checks:**

- **Levene's Test** (homogeneity of variance): PASSED (p = 0.5635 ) ✓
  → Variances are equal across groups; ANOVA is appropriate.
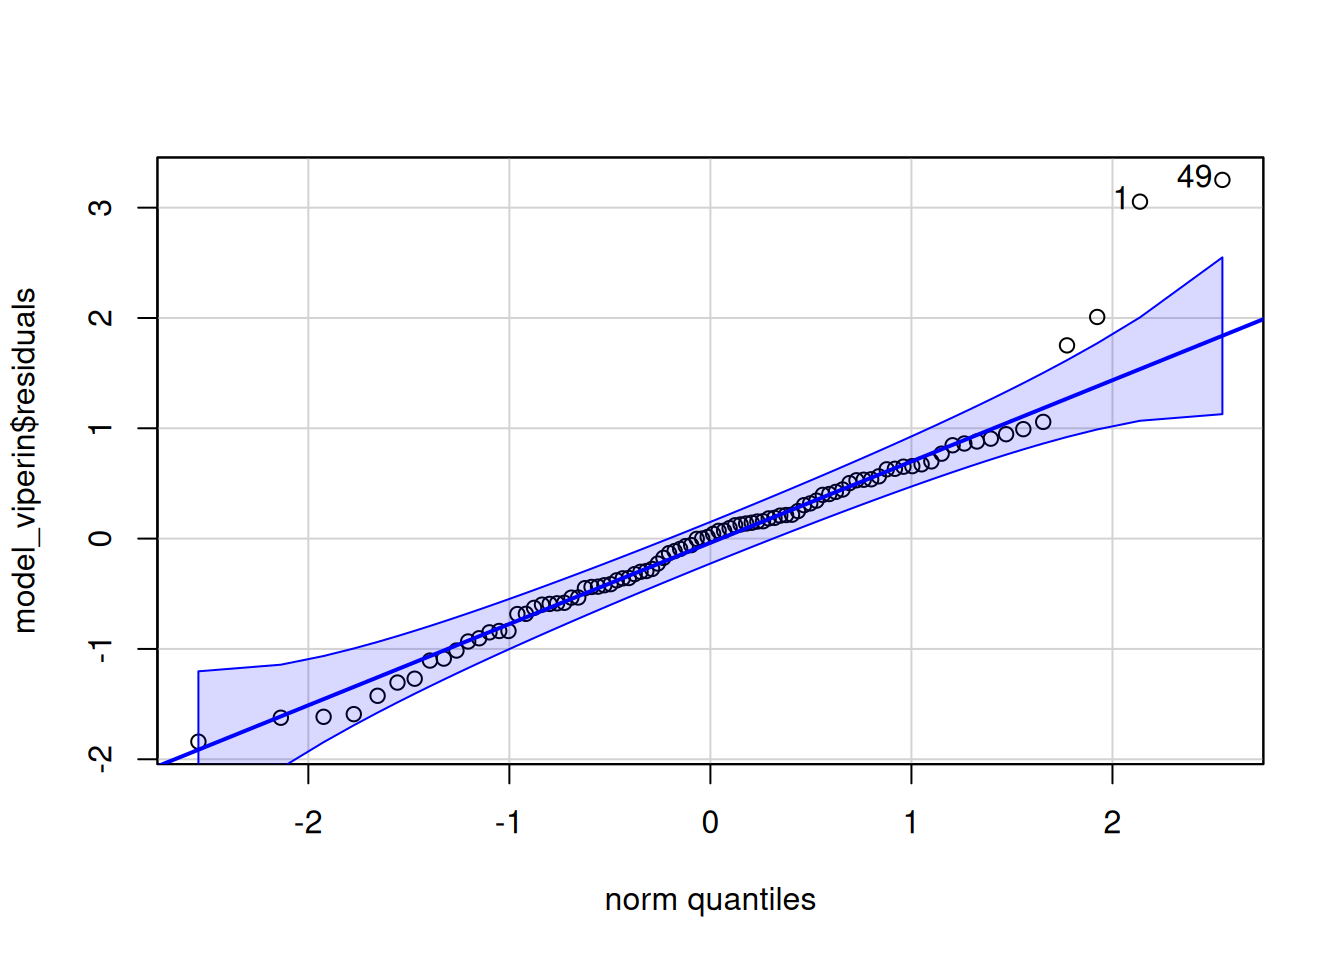
VIPERIN
Viperin limits replication of DNA and RNA viruses.
Levene's Test for Homogeneity of Variance (center = median)
      Df F value Pr(>F)
group  5  0.6136 0.6897
      86
 contrast                                     estimate    SE df t.ratio p.value
 No_PolyIC Control - PolyIC Control             1.1827 0.372 86   3.181  0.0242
 No_PolyIC Control - No_PolyIC Mechanical       0.3096 0.281 86   1.101  0.8795
 No_PolyIC Control - PolyIC Mechanical          1.0839 0.487 86   2.226  0.2367
 No_PolyIC Control - No_PolyIC Temperature      0.1363 0.281 86   0.485  0.9966
 No_PolyIC Control - PolyIC Temperature         0.7747 0.281 86   2.756  0.0748
 PolyIC Control - No_PolyIC Mechanical         -0.8731 0.372 86  -2.348  0.1866
 PolyIC Control - PolyIC Mechanical            -0.0988 0.544 86  -0.182  1.0000
 PolyIC Control - No_PolyIC Temperature        -1.0464 0.372 86  -2.814  0.0647
 PolyIC Control - PolyIC Temperature           -0.4080 0.372 86  -1.097  0.8812
 No_PolyIC Mechanical - PolyIC Mechanical       0.7743 0.487 86   1.590  0.6071
 No_PolyIC Mechanical - No_PolyIC Temperature  -0.1733 0.281 86  -0.616  0.9896
 No_PolyIC Mechanical - PolyIC Temperature      0.4651 0.281 86   1.655  0.5651
 PolyIC Mechanical - No_PolyIC Temperature     -0.9476 0.487 86  -1.946  0.3817
 PolyIC Mechanical - PolyIC Temperature        -0.3092 0.487 86  -0.635  0.9880
 No_PolyIC Temperature - PolyIC Temperature     0.6384 0.281 86   2.271  0.2173

P value adjustment: tukey method for comparing a family of 6 estimates

**VIPERIN - Pairwise Contrast Summary:**

Significant contrasts (p ≤ 0.05):
- No_PolyIC Control - PolyIC Control (p = 0.0242 )
VIPERIN ANOVA Interpretation
Code
anova_results <-summary(model_viperin)[[1]]# Fix: Trim whitespace from rownamesrownames(anova_results) <-trimws(rownames(anova_results))levene_results <-leveneTest(model_viperin$residuals ~ polyIC * stress_type, data = delta_Cq_df %>%filter(Target =="VIPERIN"))cat("**VIPERIN ANOVA Results:**\n\n")cat("This ANOVA evaluates whether PolyIC treatment and/or stress type affect VIPERIN expression (delta Cq).\n\n")cat("**Treatment Effects (ANOVA):**\n\n")if(anova_results["polyIC", "Pr(>F)"] <0.05) {cat("- **PolyIC effect**: SIGNIFICANT (p =", round(anova_results["polyIC", "Pr(>F)"], 4), ")\n")} else {cat("- **PolyIC effect**: Not significant (p =", round(anova_results["polyIC", "Pr(>F)"], 4), ")\n")}if(anova_results["stress_type", "Pr(>F)"] <0.05) {cat("- **Stress type effect**: SIGNIFICANT (p =", round(anova_results["stress_type", "Pr(>F)"], 4), ")\n")} else {cat("- **Stress type effect**: Not significant (p =", round(anova_results["stress_type", "Pr(>F)"], 4), ")\n")}if(anova_results["polyIC:stress_type", "Pr(>F)"] <0.05) {cat("- **PolyIC × Stress interaction**: SIGNIFICANT (p =", round(anova_results["polyIC:stress_type", "Pr(>F)"], 4), ")\n")cat(" → The effect of stress depends on PolyIC treatment status.\n")} else {cat("- **PolyIC × Stress interaction**: Not significant (p =", round(anova_results["polyIC:stress_type", "Pr(>F)"], 4), ")\n")}cat("\n**Assumption Checks:**\n\n")levene_p <- levene_results$`Pr(>F)`[1]if(levene_p >0.05) {cat("- **Levene's Test** (homogeneity of variance): PASSED (p =", round(levene_p, 4), ") ✓\n")cat(" → Variances are equal across groups; ANOVA is appropriate.\n")} else {cat("- **Levene's Test** (homogeneity of variance): FAILED (p =", round(levene_p, 4), ") ⚠️\n")cat(" → Variances differ across groups; ANOVA results should be interpreted with caution.\n")}
**VIPERIN ANOVA Results:**

This ANOVA evaluates whether PolyIC treatment and/or stress type affect VIPERIN expression (delta Cq).

**Treatment Effects (ANOVA):**

- **PolyIC effect**: SIGNIFICANT (p = 2e-04 )
- **Stress type effect**: Not significant (p = 0.5483 )
- **PolyIC × Stress interaction**: Not significant (p = 0.5051 )

**Assumption Checks:**

- **Levene's Test** (homogeneity of variance): PASSED (p = 0.6897 ) ✓
  → Variances are equal across groups; ANOVA is appropriate.
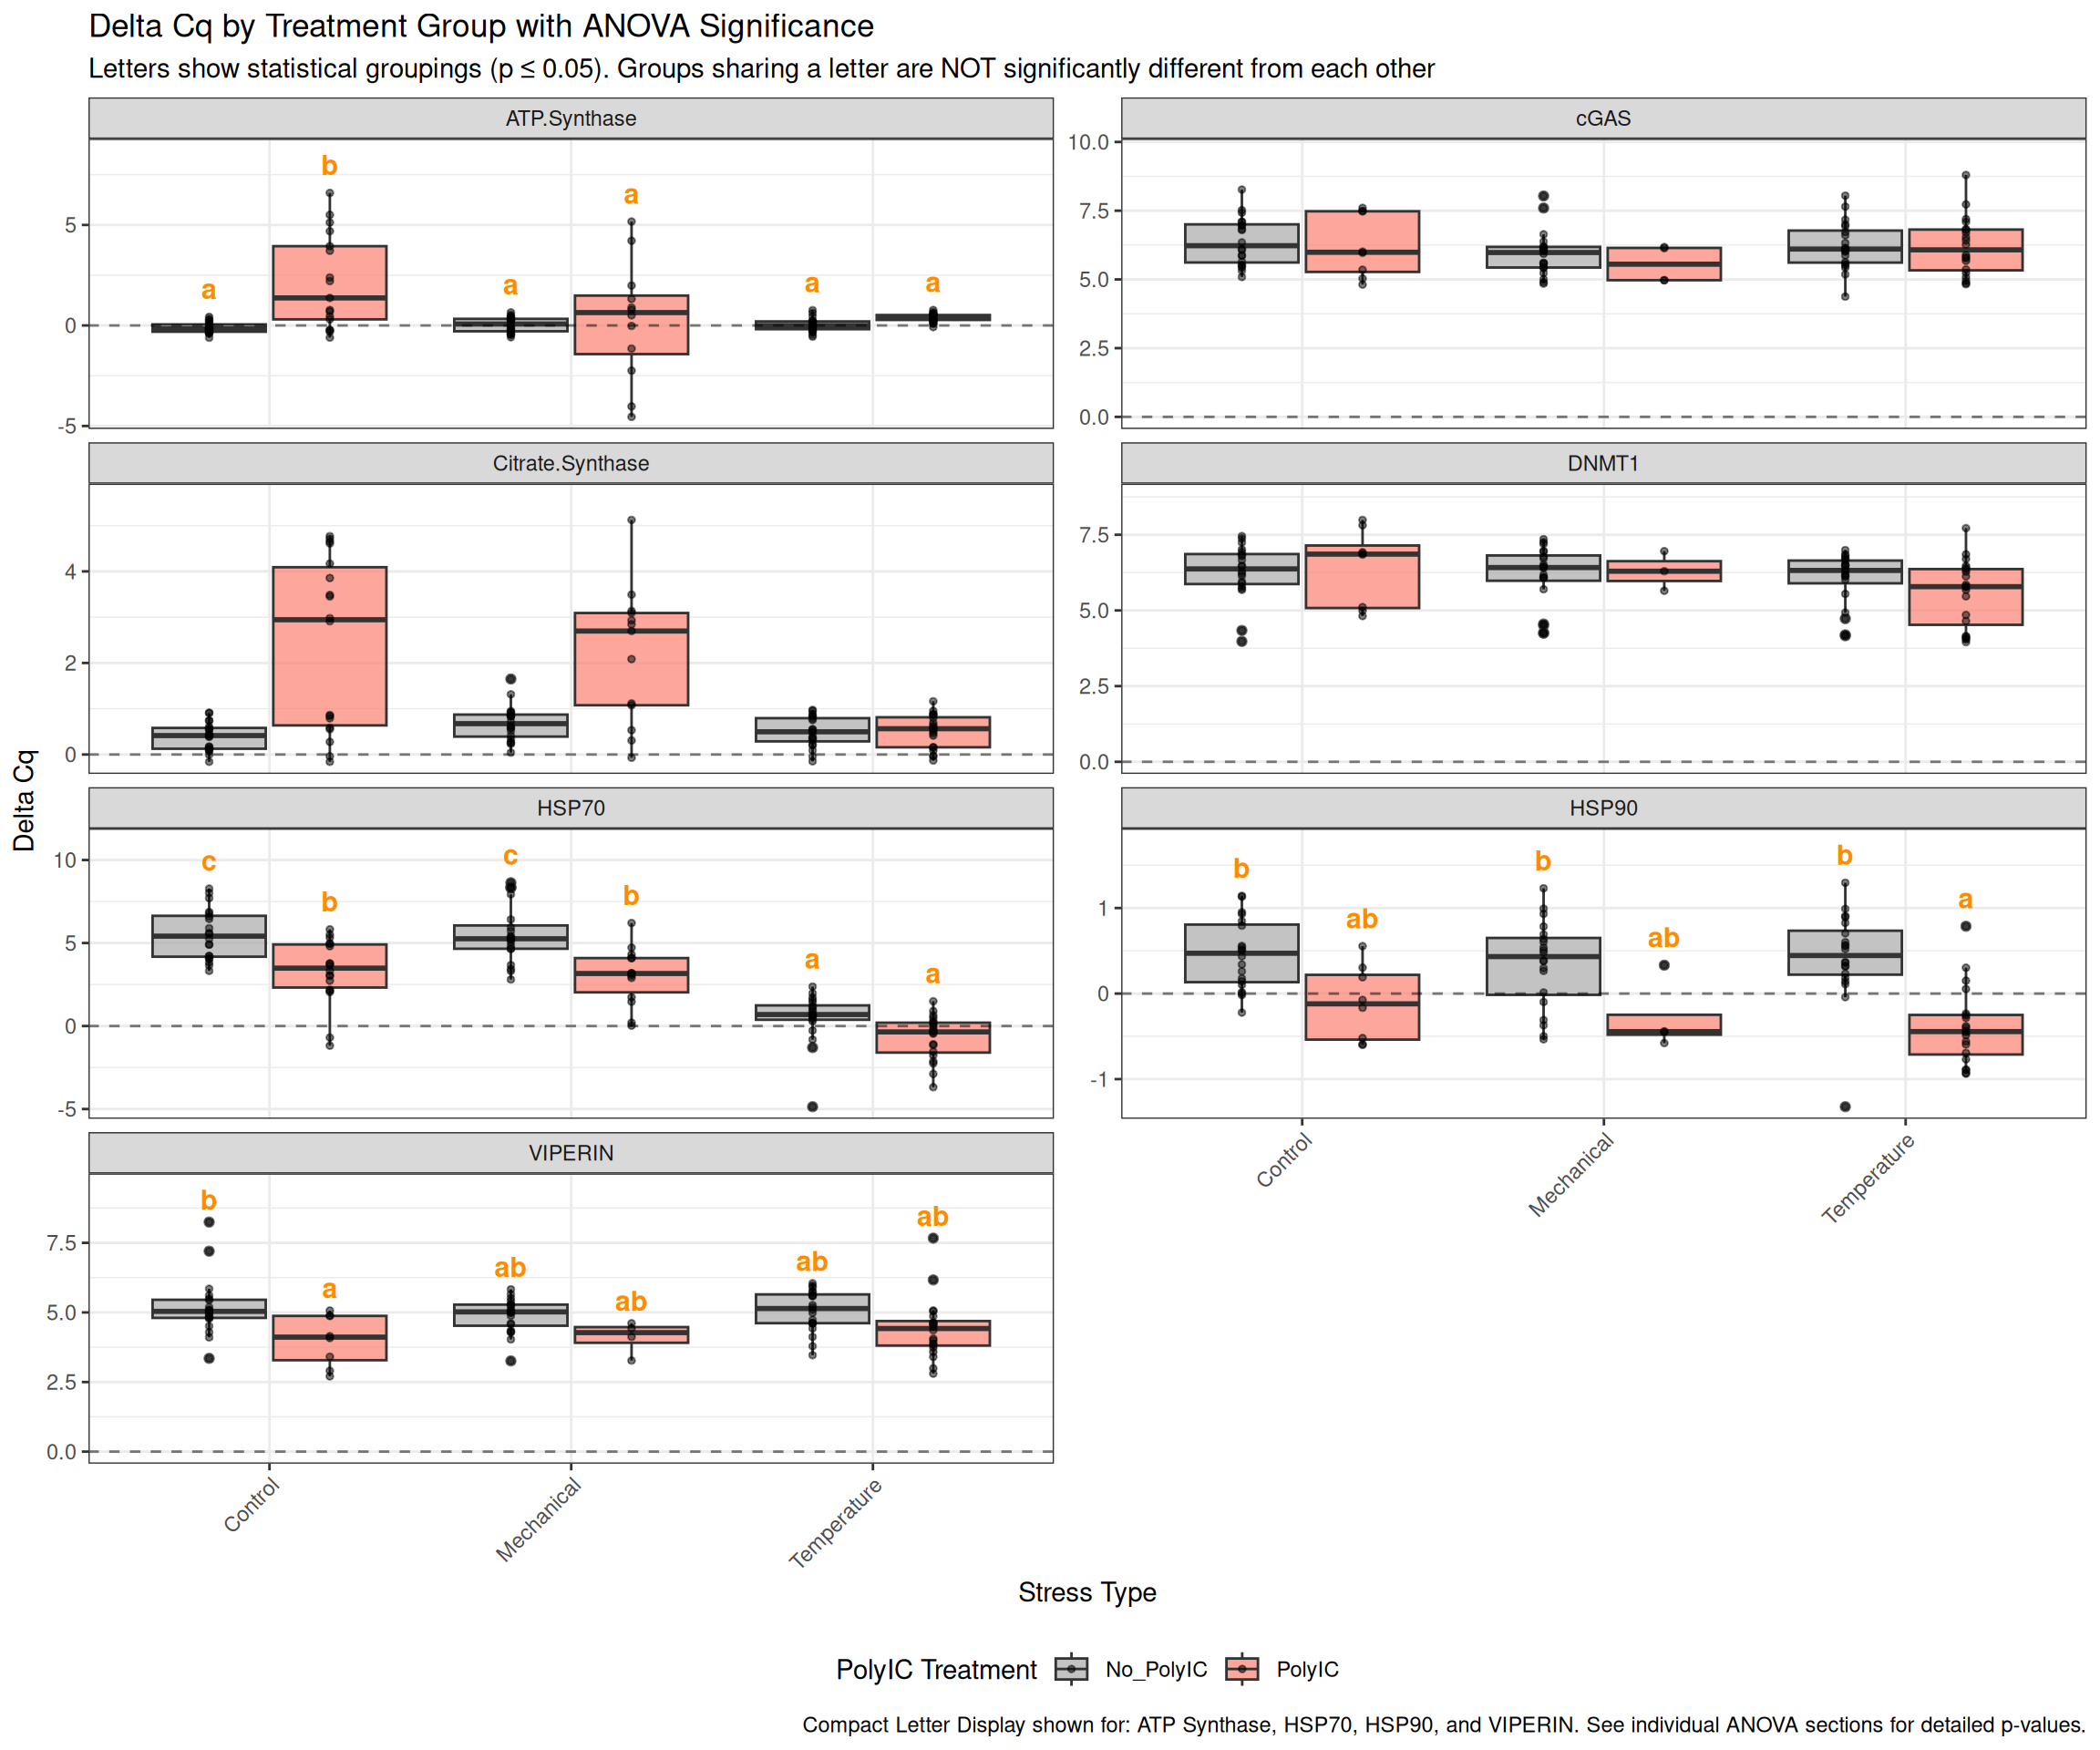
Summary Plots
Visualize delta Cq values by treatment group for each target.
Code
# Generate Compact Letter Display (CLD) for each gene with significant effects# CLD shows which groups are significantly different: groups sharing a letter are NOT significantly differentcld_annotations <-data.frame()# ATP Synthaseif(exists("emm_atp")) { cld_atp <-cld(emm_atp, Letters = letters, alpha =0.05) cld_atp_df <-as.data.frame(cld_atp) cld_atp_df$Target <-"ATP.Synthase" cld_atp_df$label <-trimws(cld_atp_df$.group) cld_atp_df <- cld_atp_df[, c("Target", "polyIC", "stress_type", "label")] cld_annotations <-rbind(cld_annotations, cld_atp_df)}# HSP70if(exists("emm_hsp70")) { cld_hsp70 <-cld(emm_hsp70, Letters = letters, alpha =0.05) cld_hsp70_df <-as.data.frame(cld_hsp70) cld_hsp70_df$Target <-"HSP70" cld_hsp70_df$label <-trimws(cld_hsp70_df$.group) cld_hsp70_df <- cld_hsp70_df[, c("Target", "polyIC", "stress_type", "label")] cld_annotations <-rbind(cld_annotations, cld_hsp70_df)}# HSP90if(exists("emm_hsp90")) { cld_hsp90 <-cld(emm_hsp90, Letters = letters, alpha =0.05) cld_hsp90_df <-as.data.frame(cld_hsp90) cld_hsp90_df$Target <-"HSP90" cld_hsp90_df$label <-trimws(cld_hsp90_df$.group) cld_hsp90_df <- cld_hsp90_df[, c("Target", "polyIC", "stress_type", "label")] cld_annotations <-rbind(cld_annotations, cld_hsp90_df)}# VIPERINif(exists("emm_viperin")) { cld_viperin <-cld(emm_viperin, Letters = letters, alpha =0.05) cld_viperin_df <-as.data.frame(cld_viperin) cld_viperin_df$Target <-"VIPERIN" cld_viperin_df$label <-trimws(cld_viperin_df$.group) cld_viperin_df <- cld_viperin_df[, c("Target", "polyIC", "stress_type", "label")] cld_annotations <-rbind(cld_annotations, cld_viperin_df)}# Calculate y positions for annotations (above max values)if(nrow(cld_annotations) >0) { y_positions <- delta_Cq_df %>%group_by(Target, stress_type, polyIC) %>%summarise(max_y =max(delta_Cq, na.rm =TRUE), .groups ="drop")# Calculate data range for each gene to use proportional offset y_range_per_gene <- delta_Cq_df %>%group_by(Target) %>%summarise(y_range =max(delta_Cq, na.rm =TRUE) -min(delta_Cq, na.rm =TRUE), .groups ="drop") cld_annotations <- cld_annotations %>%left_join(y_positions, by =c("Target", "stress_type", "polyIC")) %>%left_join(y_range_per_gene, by ="Target") %>%mutate(y_pos = max_y + y_range *0.08) # 8% of data range above max}# Create plotp <- delta_Cq_df %>%ggplot(aes(x = stress_type, y = delta_Cq, fill = polyIC)) +geom_boxplot(position =position_dodge(0.8), alpha =0.7) +geom_point(position =position_dodge(0.8), alpha =0.5, size =1) +facet_wrap(~Target, scales ="free_y", ncol =2) +scale_fill_manual(values =c("No_PolyIC"="darkgray", "PolyIC"="salmon")) +scale_y_continuous(expand =expansion(mult =c(0.05, 0.15))) +# Extra space at top for annotationsgeom_hline(yintercept =0, linetype ="dashed", alpha =0.5) +theme_bw() +labs(title ="Delta Cq by Treatment Group with ANOVA Significance",x ="Stress Type",y ="Delta Cq",fill ="PolyIC Treatment" ) +theme(axis.text.x =element_text(angle =45, hjust =1),legend.position ="bottom" )# Add CLD annotations if any existif(nrow(cld_annotations) >0) { p <- p +geom_text(data = cld_annotations, aes(x = stress_type, y = y_pos, label = label, group = polyIC),position =position_dodge(0.8), size =4, vjust =0, color ="darkorange", fontface ="bold") +labs(subtitle ="Letters show statistical groupings (p ≤ 0.05). Groups sharing a letter are NOT significantly different from each other",caption ="Compact Letter Display shown for: ATP Synthase, HSP70, HSP90, and VIPERIN. See individual ANOVA sections for detailed p-values.")}print(p)
SUMMARY
This analysis examined gene expression responses in Magallana gigas to PolyIC treatment (an immune stimulant mimicking viral dsRNA) and different stress types (Temperature, Mechanical, Control) using qPCR. Eight genes were analyzed: ATP Synthase, Citrate Synthase, DNMT1, HSP70, HSP90, cGAS, and VIPERIN. Expression levels were normalized to GAPDH and analyzed using two-way ANOVA (PolyIC × Stress Type) with post-hoc pairwise comparisons.
Gene-Specific Results
ATP Synthase
Function: Mitochondrial enzyme synthesizing ATP; marker of energy metabolism.
ANOVA Results:
PolyIC effect: SIGNIFICANT (p = 7.33e-06) ***
Stress type effect: SIGNIFICANT (p = 0.04) *
PolyIC × Stress interaction: Not significant (p = 0.47)
Assumption Checks:
Levene’s Test: FAILED (p = 0.0036) - variances are not homogeneous across groups ⚠️
Significant Pairwise Contrasts (p ≤ 0.05):
No_PolyIC Control vs PolyIC Mechanical (p = 0.007)
No_PolyIC Control vs PolyIC Temperature (p = 0.0001)
No_PolyIC Mechanical vs PolyIC Temperature (p = 0.0195)
No_PolyIC Temperature vs PolyIC Temperature (p = 0.0158)
Key Findings:
PolyIC treatment significantly affects ATP Synthase expression
The “stress type effect” is driven primarily by PolyIC-treated samples under stress (all significant contrasts involve PolyIC groups)
No significant differences between non-PolyIC control and non-PolyIC stressed groups
Effects are additive rather than interactive (no interaction between PolyIC and stress)
PolyIC + Temperature shows the strongest effect (lowest p-value), followed by PolyIC + Mechanical
Caveat: Heterogeneous variances suggest results should be interpreted cautiously
Citrate Synthase
Function: TCA cycle enzyme; marker of mitochondrial density and oxidative capacity.
ANOVA Results:
PolyIC effect: Not significant (p = 0.693)
Stress type effect: Marginally non-significant (p = 0.0688)
PolyIC × Stress interaction: Not significant (p = 0.464)
Assumption Checks:
Levene’s Test: PASSED (p = 0.956) ✓
Key Findings:
Citrate Synthase expression is stable across PolyIC treatments
Stress type shows a trend toward significance (p = 0.0688) but does not reach the p ≤ 0.05 threshold
No significant pairwise contrasts detected (all p > 0.05)
This near-significant trend without specific contrasts suggests subtle, distributed differences across stress types rather than a strong specific effect
Mitochondrial density/function appears relatively unaffected by these experimental conditions
DNMT1
Function: DNA methyltransferase enzyme; maintains DNA methylation patterns and epigenetic regulation.
ANOVA Results:
PolyIC effect: Not significant (p = 0.193)
Stress type effect: Not significant (p = 0.179)
PolyIC × Stress interaction: Not significant (p = 0.399)
Assumption Checks:
Levene’s Test: PASSED (p = 0.617) ✓
Key Findings:
DNMT1 expression does not respond significantly to PolyIC or stress treatments
DNA methylation machinery appears constitutively expressed under these conditions
No evidence of stress-induced epigenetic remodeling at the transcriptional level
HSP70
Function: Molecular chaperone; critical for protein folding and cellular stress response.
ANOVA Results:
PolyIC effect: SIGNIFICANT (p = 5.7e-13) ***
Stress type effect: SIGNIFICANT (p < 2e-16) ***
PolyIC × Stress interaction: Not significant (p = 0.831)
Assumption Checks:
Levene’s Test: PASSED (p = 0.745) ✓
Significant Pairwise Contrasts (p ≤ 0.05):
No_PolyIC Control vs No_PolyIC Temperature (p < 0.0001)
No_PolyIC Control vs PolyIC Temperature (p < 0.0001)
PolyIC Control vs No_PolyIC Temperature (p < 0.0001)
PolyIC Control vs PolyIC Temperature (p < 0.0001)
No_PolyIC Mechanical vs No_PolyIC Temperature (p < 0.0001)
No_PolyIC Mechanical vs PolyIC Temperature (p < 0.0001)
PolyIC Mechanical vs No_PolyIC Temperature (p = 0.0017)
PolyIC Mechanical vs PolyIC Temperature (p < 0.0001)
Key Findings:
HSP70 shows extremely strong responses to both PolyIC and stress type
Temperature stress is the primary driver: All 8 significant contrasts involve temperature-stressed groups vs. non-temperature groups
Both PolyIC and non-PolyIC oysters show dramatic HSP70 upregulation under temperature stress compared to controls or mechanical stress
Mechanical stress does NOT significantly induce HSP70 (no significant Control vs Mechanical contrasts)
No interaction suggests PolyIC and temperature stress act independently (additive effects)
This is the classic heat shock protein response to thermal stress
HSP90
Function: Molecular chaperone; regulates protein maturation and signaling networks.
ANOVA Results:
PolyIC effect: SIGNIFICANT (p = 5.47e-10) ***
Stress type effect: Not significant (p = 0.476)
PolyIC × Stress interaction: Not significant (p = 0.562)
Assumption Checks:
Levene’s Test: PASSED (p = 0.942) ✓
Significant Pairwise Contrasts (p ≤ 0.05):
No_PolyIC Control vs PolyIC Temperature (p < 0.0001)
No_PolyIC Mechanical vs PolyIC Temperature (p < 0.0001)
No_PolyIC Temperature vs PolyIC Temperature (p < 0.0001)
Key Findings:
PolyIC has a highly significant main effect on HSP90 expression
Unlike HSP70, the overall stress type main effect is not significant
All three significant contrasts specifically involve PolyIC + Temperature:
PolyIC Temperature differs from all three non-PolyIC groups (Control, Mechanical, Temperature)
No other treatment combinations show significant differences
The pattern shows PolyIC + Temperature creates a synergistic-like response despite the non-significant interaction term (possibly due to sample size/power)
PolyIC alone (control), temperature alone, and mechanical stress (with/without PolyIC) do NOT significantly induce HSP90
HSP90 appears to require the combination of immune stimulation (PolyIC) AND thermal stress
cGAS
Function: Cytosolic DNA sensor; involved in innate immune response and dsRNA detection.
ANOVA Results:
PolyIC effect: Not significant (p = 0.749)
Stress type effect: Not significant (p = 0.168)
PolyIC × Stress interaction: Not significant (p = 0.831)
Assumption Checks:
Levene’s Test: PASSED (p = 0.564) ✓
Key Findings:
cGAS does not respond significantly to PolyIC treatment
No significant response to stress type either
This is unexpected given cGAS’s role in detecting foreign nucleic acids
May suggest: (1) different immune sensing pathways activated, (2) timing issues (response may occur earlier/later), or (3) PolyIC recognition occurs through alternative receptors in oysters
VIPERIN
Function: Antiviral effector protein; restricts replication of DNA and RNA viruses.
ANOVA Results:
PolyIC effect: SIGNIFICANT (p = 0.000165) ***
Stress type effect: Not significant (p = 0.548)
PolyIC × Stress interaction: Not significant (p = 0.505)
Assumption Checks:
Levene’s Test: PASSED (p = 0.690) ✓
Significant Pairwise Contrasts (p ≤ 0.05):
No_PolyIC Control vs PolyIC Control (p = 0.0242)
Key Findings:
VIPERIN shows a clear response to PolyIC treatment as an immune stimulant
The only significant contrast is No_PolyIC Control vs PolyIC Control (p = 0.024)
PolyIC alone is sufficient to induce VIPERIN expression - no additional stress needed
Notably, PolyIC + stress combinations (mechanical/temperature) are NOT significantly different from PolyIC control
This indicates the VIPERIN response is triggered by PolyIC recognition itself, independent of other stressors
Stress type (temperature/mechanical) does not enhance or suppress the PolyIC-induced VIPERIN response
As an antiviral effector, VIPERIN appropriately recognizes PolyIC as a viral mimic