INTRO
Steven asked me to plot just the the raw fluorescence of resazurin data from the Pacific oyster USDA heat stress experiments we’d run up until now. The data is raw fluorescence, which means it has not been processed or normalized in any way.
This notebook will be updated as we continue to run more experiments and collect more data, so it will be a living document that evolves over time.
- 20260415 was conducted with adults, while all other experiments were with juveniles.
- In the 20260415 experiment, Steven changed the temperature from 36°C to 40°C at some point during the experiment (timepoint currently unknown).
Analysis was/is performed in R and Knitted to markdown below:
Plots were generated from the following data file (exported from plot_df object in the Rmd):
Steven asked that I add a brief summary of the statistical analyses performed on the AUC data for each experiment, so here is a table summarizing the ANOVA results and significant pairwise comparisons for each experiment:
| Date | Duration | AUC ANOVA (family) | Highest families (mean AUC) | Lowest families (mean AUC) | Significant pairwise (AUC) |
|---|---|---|---|---|---|
| 2026-04-15 | T1 – T7 h | F(8,117) = 0.817, p = 0.589 | 3 (0.0445), 7 (0.0393), 8 (0.0341) | 6 (0.0152), 9 (0.0279), 2 (0.0295) | None |
| 2026-06-02 | T0 – T4 h | F(8,90) = 1.489, p = 0.172 | 6 (0.563), 1 (0.530), 7 (0.505) | 9b (0.267), 3 (0.280), 9 (0.296) | None |
| 2026-06-04 | T0 – T4 h | F(8,90) = 1.671, p = 0.116 | 1 (0.584), 7 (0.552), 6 (0.533) | 9 (0.356), 9b (0.390), 5 (0.409) | None |
Across all three 36°C heat stress experiments, one-way ANOVA on area-normalised AUC found no statistically significant effect of USDA family (all p ≥ 0.116, Tukey-adjusted pairwise comparisons all non-significant), though families 1, 6, and 7 consistently ranked among the highest metabolic responders in the two June juvenile experiments while families 9 and 9b were consistently among the lowest.
1 Background
Combines raw fluorescence data from all 36°C heat stress resazurin assay experiments and produces a single per-individual fluorescence trace plot across all runs. Individuals that share the same sample_ID.group value in different experiments are not the same animal; a globally-unique ID is constructed from the experiment date and the within-experiment sample ID.
Blank wells and samples flagged exclude_from_analysis = TRUE in any layout file are excluded from the plots.
| Experiment | Data directory | Time range |
|---|---|---|
| 2026-04-15 | 20260415-36C | T1 - T7 h |
| 2026-06-02 | 20260602-mgig-36C | T0 - T4 h |
| 2026-06-04 | 20260604-mgig-36C | T0 - T4 h |
1.1 IMPORTANT NOTES
- 20260415 was conducted with adults, while all other experiments were with juveniles.
- In the 20260415 experiment, Steven changed the temperature from 36°C to 40°C at some point during the experiment (timepoint currently unknown).
2 Setup
2.1 Knitr options
knitr::opts_chunk$set(
  echo = TRUE,         # Display code chunks
  eval = TRUE,        # Evaluate code chunks
  warning = FALSE,     # Hide warnings
  message = FALSE,     # Hide messages
  comment = "",         # Prevents appending '##' to beginning of lines in code output
  results = 'hold'     # Holds output so it's all printed together after code chunk
)
2.2 Load libraries
library(tidyverse)
library(colorspace)
library(rprojroot)
3 Helper Functions
normalize_well_id <- function(x) {
  x <- toupper(trimws(x))
  valid <- str_detect(x, "^[A-Z]+[0-9]+$")
  out <- rep(NA_character_, length(x))
  if (!any(valid)) return(out)
  m <- str_match(x[valid], "^([A-Z]+)([0-9]+)$")
  out[valid] <- paste0(m[, 2], as.integer(m[, 3]))
  out
}

parse_time_hr <- function(path) {
  hit <- str_match(basename(path), "(?i)-T([0-9]+(?:\\.[0-9]+)?)\\.txt$")
  as.numeric(hit[, 2])
}

parse_plate_id <- function(path) {
  hit <- str_match(basename(path),
    "(?i)^plate-([A-Za-z0-9-]+)-T[0-9]+(?:\\.[0-9]+)?\\.txt$")
  id <- hit[, 2]
  ifelse(is.na(id), "unknown", id)
}

extract_results_block <- function(lines) {
  results_idx <- which(trimws(lines) == "Results")
  if (length(results_idx) == 0) stop("No Results section found")
  idx <- results_idx[1]
  header_tokens <- str_split(lines[idx + 1], "\\t")[[1]] |> trimws()
  col_ids <- header_tokens[
    header_tokens != "" & str_detect(header_tokens, "^[0-9]+$")]
  j <- idx + 2
  data_lines <- character()
  while (j <= length(lines)) {
    line <- lines[j]
    if (trimws(line) == "") break
    if (!str_detect(line, "^[A-Za-z]\\t")) break
    data_lines <- c(data_lines, line)
    j <- j + 1
  }
  list(col_ids = col_ids, data_lines = data_lines)
}

parse_plate_export <- function(path) {
  lines <- readLines(path, warn = FALSE)
  res   <- extract_results_block(lines)
  map_dfr(res$data_lines, function(line) {
    tokens <- str_split(line, "\\t")[[1]] |> trimws()
    tokens <- tokens[tokens != ""]
    row_letter <- tokens[1]
    nums <- suppressWarnings(as.numeric(tokens[-1]))
    valid_idx <- which(!is.na(nums))
    if (length(valid_idx) == 0) return(tibble())
    vals <- nums[valid_idx]
    n <- min(length(vals), length(res$col_ids))
    tibble(
      row_id  = toupper(row_letter),
      col_id  = as.integer(res$col_ids[seq_len(n)]),
      well_id = normalize_well_id(
        paste0(toupper(row_letter), res$col_ids[seq_len(n)])),
      value   = vals[seq_len(n)]
    )
  }) %>%
    mutate(
      plate_id = str_to_lower(parse_plate_id(path)),
      time_hr  = parse_time_hr(path)
    )
}

standardize_names <- function(nms) {
  nms |>
    str_to_lower() |>
    str_replace_all("[^a-z0-9]+", "_") |>
    str_replace_all("_+", "_") |>
    str_replace("_$", "")
}

okabe_ito_7 <- c(
  "#E69F00", "#56B4E9", "#009E73", "#F0E442",
  "#0072B2", "#D55E00", "#CC79A7"
)

make_palette <- function(n) {
  if (n == 0L) return(character(0))
  if (n <= length(okabe_ito_7)) return(okabe_ito_7[seq_len(n)])
  qualitative_hcl(n, palette = "Dynamic")
}
4 Experiment Registry
proj_root <- find_rstudio_root_file()

experiments <- tibble(
  exp_id   = c("20260415", "20260602", "20260604"),
  data_dir = c(
    "20260415-36C",
    "20260602-mgig-36C",
    "20260604-mgig-36C"
  )
)

str(experiments)
tibble [3 × 2] (S3: tbl_df/tbl/data.frame)
$ exp_id : chr [1:3] "20260415" "20260602" "20260604"
$ data_dir: chr [1:3] "20260415-36C" "20260602-mgig-36C" "20260604-mgig-36C"5 Load Data
5.1 Plate fluorescence files
plates_raw <- map_dfr(seq_len(nrow(experiments)), function(i) {
  dir   <- file.path(proj_root, "Resazurin", "data", experiments$data_dir[i])
  files <- list.files(
    dir,
    pattern    = "(?i)^plate-.*-T[0-9]+(?:\\.[0-9]+)?\\.txt$",
    full.names = TRUE
  )
  map_dfr(files, ~ tryCatch(parse_plate_export(.x),
                             error = function(e) tibble())) %>%
    mutate(exp_id = experiments$exp_id[i])
})

str(plates_raw)
tibble [2,880 × 7] (S3: tbl_df/tbl/data.frame)
$ row_id : chr [1:2880] "A" "A" "A" "A" ...
$ col_id : int [1:2880] 1 2 3 4 5 6 7 8 9 10 ...
$ well_id : chr [1:2880] "A1" "A2" "A3" "A4" ...
$ value : num [1:2880] 727 599 672 685 639 720 683 686 794 975 ...
$ plate_id: chr [1:2880] "a" "a" "a" "a" ...
$ time_hr : num [1:2880] 1 1 1 1 1 1 1 1 1 1 ...
$ exp_id : chr [1:2880] "20260415" "20260415" "20260415" "20260415" ...5.2 Layout files
layouts_raw <- map_dfr(seq_len(nrow(experiments)), function(i) {
  path <- file.path(proj_root, "Resazurin", "data",
                    experiments$data_dir[i], "layout.csv")
  raw  <- read_csv(path, col_types = cols(.default = "c"),
                   show_col_types = FALSE)
  names(raw) <- standardize_names(names(raw))
  raw %>%
    mutate(
      plate_id = str_remove(str_to_lower(plate_id), "^plate-"),
      well_id  = normalize_well_id(plate_well),
      is_blank = toupper(trimws(is_blank)) %in%
                   c("TRUE", "T", "1", "YES", "Y"),
      exclude_from_analysis =
        if ("exclude_from_analysis" %in% names(raw))
          toupper(trimws(exclude_from_analysis)) %in%
            c("TRUE", "T", "1", "YES", "Y")
        else
          FALSE,
      family_id_group = str_to_lower(trimws(family_id_group)),
      exp_id = experiments$exp_id[i]
    ) %>%
    select(exp_id, plate_id, well_id,
           is_blank, exclude_from_analysis,
           family_id_group, sample_id_group)
})

str(layouts_raw)
tibble [1,176 × 7] (S3: tbl_df/tbl/data.frame)
$ exp_id : chr [1:1176] "20260415" "20260415" "20260415" "20260415" ...
$ plate_id : chr [1:1176] "a" "a" "a" "a" ...
$ well_id : chr [1:1176] "A1" "A2" "A3" "A4" ...
$ is_blank : logi [1:1176] FALSE FALSE FALSE FALSE FALSE FALSE ...
$ exclude_from_analysis: logi [1:1176] FALSE FALSE FALSE FALSE FALSE FALSE ...
$ family_id_group : chr [1:1176] "1" "9" "9" "9" ...
$ sample_id_group : chr [1:1176] "47" "38" "52" "57" ...5.3 Merge plate data with layout
all_dat <- plates_raw %>%
  left_join(layouts_raw,
            by = c("exp_id", "plate_id", "well_id")) %>%
  mutate(
    is_blank              = replace_na(is_blank, FALSE),
    exclude_from_analysis = replace_na(exclude_from_analysis, FALSE)
  )

str(all_dat)
tibble [2,880 × 11] (S3: tbl_df/tbl/data.frame)
$ row_id : chr [1:2880] "A" "A" "A" "A" ...
$ col_id : int [1:2880] 1 2 3 4 5 6 7 8 9 10 ...
$ well_id : chr [1:2880] "A1" "A2" "A3" "A4" ...
$ value : num [1:2880] 727 599 672 685 639 720 683 686 794 975 ...
$ plate_id : chr [1:2880] "a" "a" "a" "a" ...
$ time_hr : num [1:2880] 1 1 1 1 1 1 1 1 1 1 ...
$ exp_id : chr [1:2880] "20260415" "20260415" "20260415" "20260415" ...
$ is_blank : logi [1:2880] FALSE FALSE FALSE FALSE FALSE FALSE ...
$ exclude_from_analysis: logi [1:2880] FALSE FALSE FALSE FALSE FALSE FALSE ...
$ family_id_group : chr [1:2880] "1" "9" "9" "9" ...
$ sample_id_group : chr [1:2880] "47" "38" "52" "57" ...6 Filter Samples
Remove blank wells, excluded samples, and any wells without layout metadata. Create a globally-unique individual identifier so same-numbered samples from different experiments are treated as distinct animals.
plot_df <- all_dat %>%
  filter(
    !is_blank,
    !exclude_from_analysis,
    !is.na(family_id_group),
    !is.na(sample_id_group),
    is.finite(time_hr),
    is.finite(value)
  ) %>%
  mutate(
    unique_id  = paste(exp_id, sample_id_group, sep = "_"),
    family     = factor(family_id_group,
                        levels = sort(unique(family_id_group))),
    experiment = factor(exp_id)
  )

str(plot_df)
tibble [2,389 × 14] (S3: tbl_df/tbl/data.frame)
$ row_id : chr [1:2389] "A" "A" "A" "A" ...
$ col_id : int [1:2389] 1 2 3 4 5 6 7 8 9 10 ...
$ well_id : chr [1:2389] "A1" "A2" "A3" "A4" ...
$ value : num [1:2389] 727 599 672 685 639 720 683 686 794 975 ...
$ plate_id : chr [1:2389] "a" "a" "a" "a" ...
$ time_hr : num [1:2389] 1 1 1 1 1 1 1 1 1 1 ...
$ exp_id : chr [1:2389] "20260415" "20260415" "20260415" "20260415" ...
$ is_blank : logi [1:2389] FALSE FALSE FALSE FALSE FALSE FALSE ...
$ exclude_from_analysis: logi [1:2389] FALSE FALSE FALSE FALSE FALSE FALSE ...
$ family_id_group : chr [1:2389] "1" "9" "9" "9" ...
$ sample_id_group : chr [1:2389] "47" "38" "52" "57" ...
$ unique_id : chr [1:2389] "20260415_47" "20260415_38" "20260415_52" "20260415_57" ...
$ family : Factor w/ 10 levels "1","10","2","3",..: 1 9 9 9 9 9 4 9 4 1 ...
$ experiment : Factor w/ 3 levels "20260415","20260602",..: 1 1 1 1 1 1 1 1 1 1 ...6.1 Write plot_df to CSV
out_dir <- file.path(proj_root, "Resazurin", "outputs",
                     "02.00-resazurin-raw-all-36C-heat-stress-experiments")

dir.create(out_dir, recursive = TRUE, showWarnings = FALSE)

write_csv(plot_df, file.path(out_dir, "plot_df.csv"))

message("plot_df written to: ", out_dir)
7 Color Palettes
fam_palette <- setNames(
  make_palette(nlevels(plot_df$family)),
  levels(plot_df$family)
)

str(fam_palette)
Named chr [1:10] "#DB9D85" "#C2A968" "#9DB469" "#6DBC86" "#3DBEAB" ...
- attr(*, "names")= chr [1:10] "1" "10" "2" "3" ...exp_palette <- setNames(
c("#1B9E77", "#D95F02", "#7570B3"),
levels(plot_df$experiment)
)
str(exp_palette) Named chr [1:3] "#1B9E77" "#D95F02" "#7570B3"
- attr(*, "names")= chr [1:3] "20260415" "20260602" "20260604"8 Raw Fluorescence Plots
8.1 Colored by family
Each line is one individual oyster; color indicates USDA family. Panels separate experiments (x-axes are free since time ranges differ).
p_by_family <- ggplot(
    plot_df,
    aes(x      = time_hr,
        y      = value,
        group  = unique_id,
        colour = family)
  ) +
  geom_line(alpha = 0.5, linewidth = 0.4) +
  geom_point(size = 0.7, alpha = 0.5) +
  facet_wrap(
    ~ exp_id,
    scales   = "free_x",
    labeller = labeller(exp_id = c(
      "20260415" = "2026-04-15",
      "20260602" = "2026-06-02",
      "20260604" = "2026-06-04"
    ))
  ) +
  scale_colour_manual(values = fam_palette, name = "Family") +
  labs(
    title = "Raw fluorescence - all 36°C heat stress experiments",
    x     = "Time (h)",
    y     = "Raw fluorescence (RFU)"
  ) +
  theme_classic(base_size = 12) +
  theme(
    strip.background = element_blank(),
    strip.text       = element_text(face = "bold"),
    legend.position  = "right"
  )

p_by_family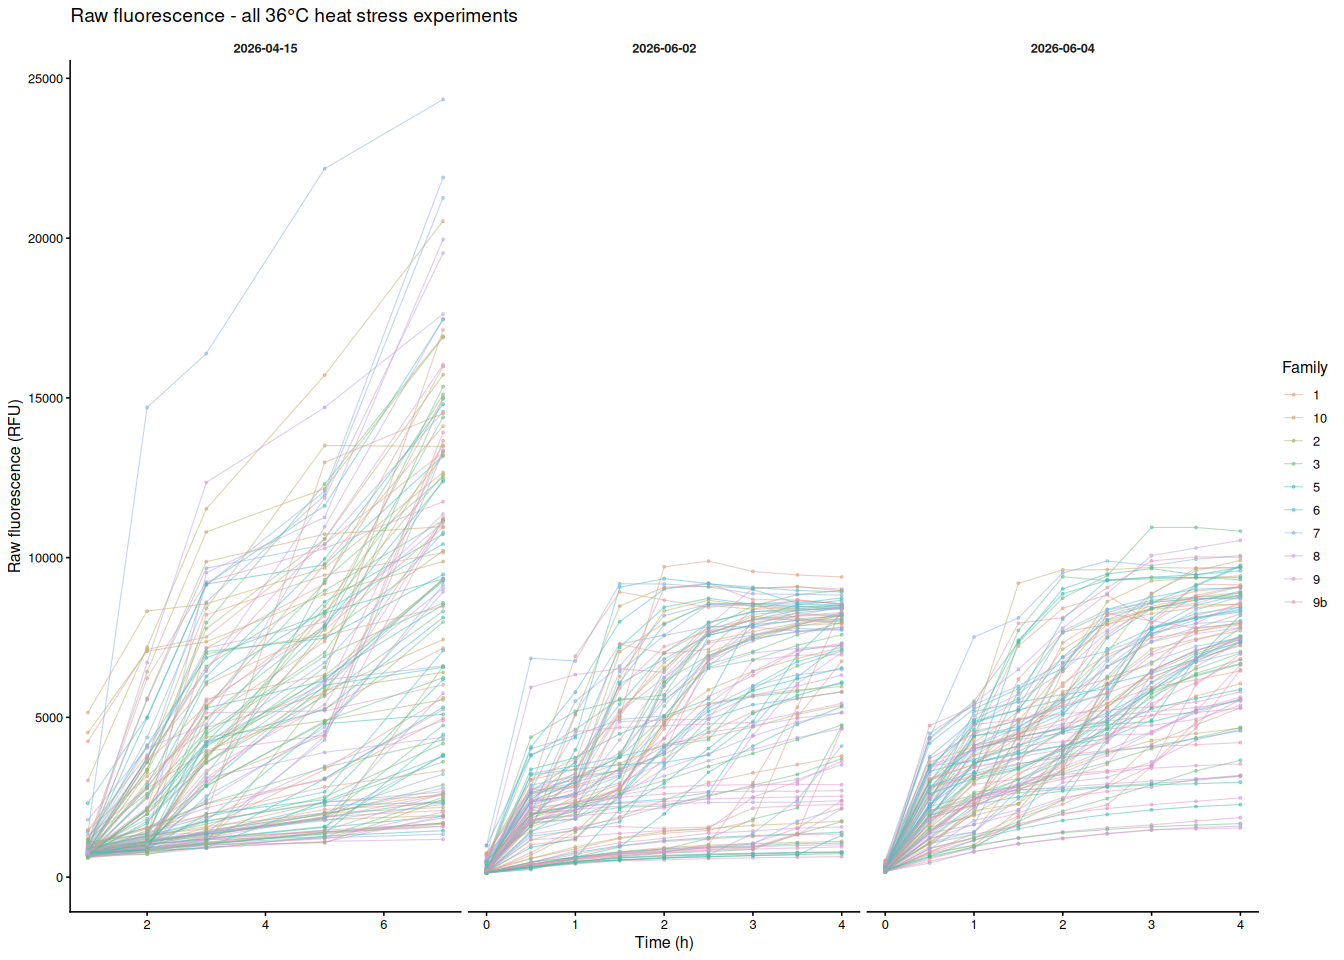
8.2 Colored by experiment
Each line is one individual oyster; color indicates experiment date. Panels separate experiments (x-axes are free since time ranges differ).
p_by_experiment <- ggplot(
    plot_df,
    aes(x      = time_hr,
        y      = value,
        group  = unique_id,
        colour = experiment)
  ) +
  geom_line(alpha = 0.5, linewidth = 0.4) +
  geom_point(size = 0.7, alpha = 0.5) +
  facet_wrap(
    ~ exp_id,
    scales   = "free_x",
    labeller = labeller(exp_id = c(
      "20260415" = "2026-04-15",
      "20260602" = "2026-06-02",
      "20260604" = "2026-06-04"
    ))
  ) +
  scale_colour_manual(
    values = exp_palette,
    name   = "Experiment",
    labels = c(
      "20260415" = "2026-04-15",
      "20260602" = "2026-06-02",
      "20260604" = "2026-06-04"
    )
  ) +
  labs(
    title = "Raw fluorescence - all 36°C heat stress experiments",
    x     = "Time (h)",
    y     = "Raw fluorescence (RFU)"
  ) +
  theme_classic(base_size = 12) +
  theme(
    strip.background = element_blank(),
    strip.text       = element_text(face = "bold"),
    legend.position  = "right"
  )

p_by_experiment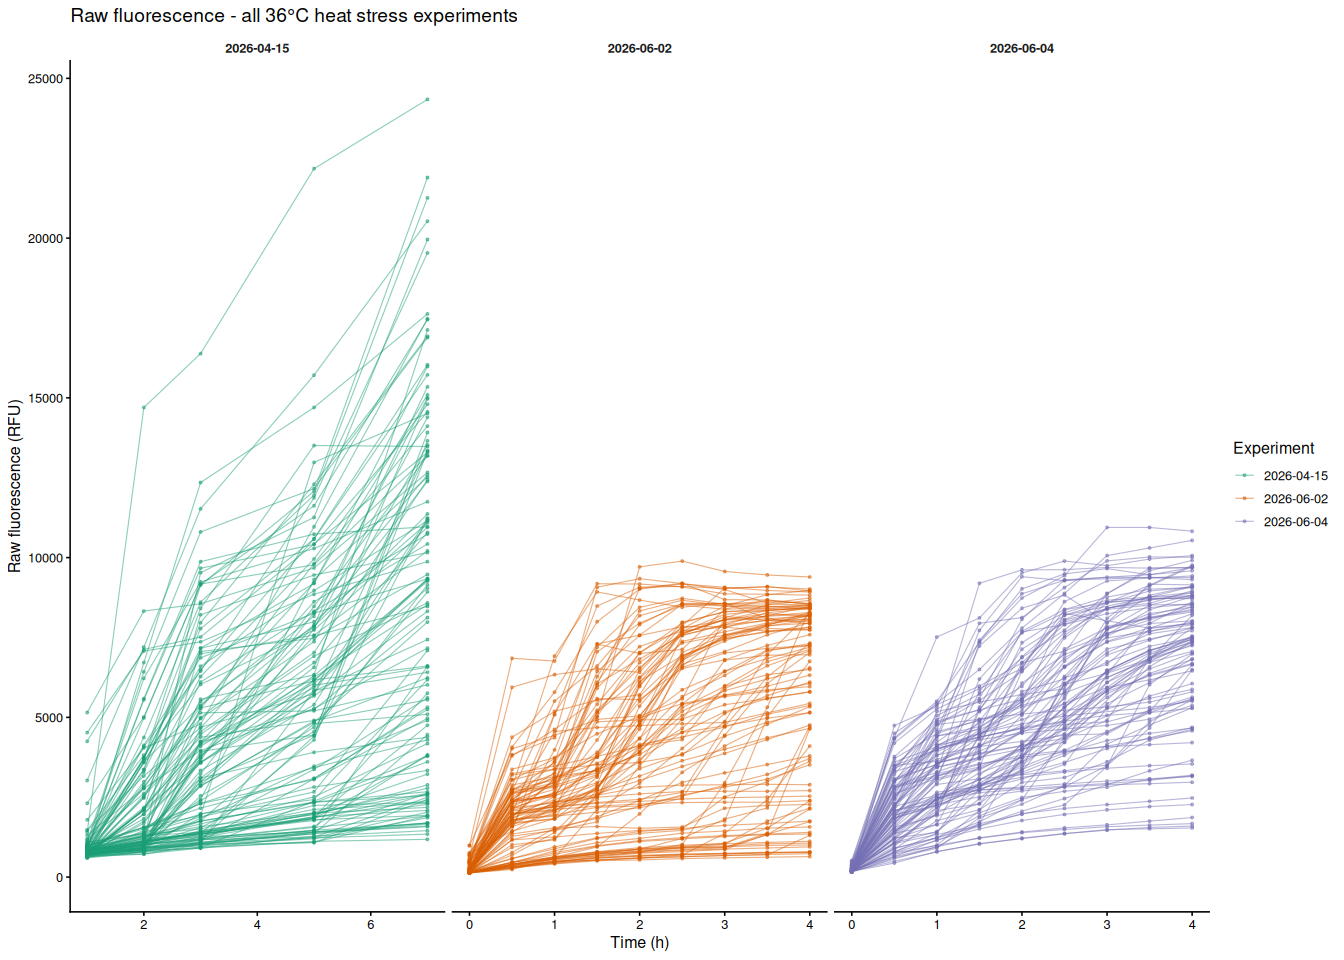
8.3 All individuals colored by experiment (single panel)
Each line is one individual oyster; color indicates experiment date.
p_all_by_experiment <- ggplot(
    plot_df,
    aes(x      = time_hr,
        y      = value,
        group  = unique_id,
        colour = experiment)
  ) +
  geom_line(alpha = 0.4, linewidth = 0.4) +
  geom_point(size = 0.6, alpha = 0.4) +
  scale_colour_manual(
    values = exp_palette,
    name   = "Experiment",
    labels = c(
      "20260415" = "2026-04-15",
      "20260602" = "2026-06-02",
      "20260604" = "2026-06-04"
    )
  ) +
  labs(
    title = "Raw fluorescence - all 36°C heat stress experiments",
    x     = "Time (h)",
    y     = "Raw fluorescence (RFU)"
  ) +
  theme_classic(base_size = 12) +
  theme(legend.position = "right")

p_all_by_experiment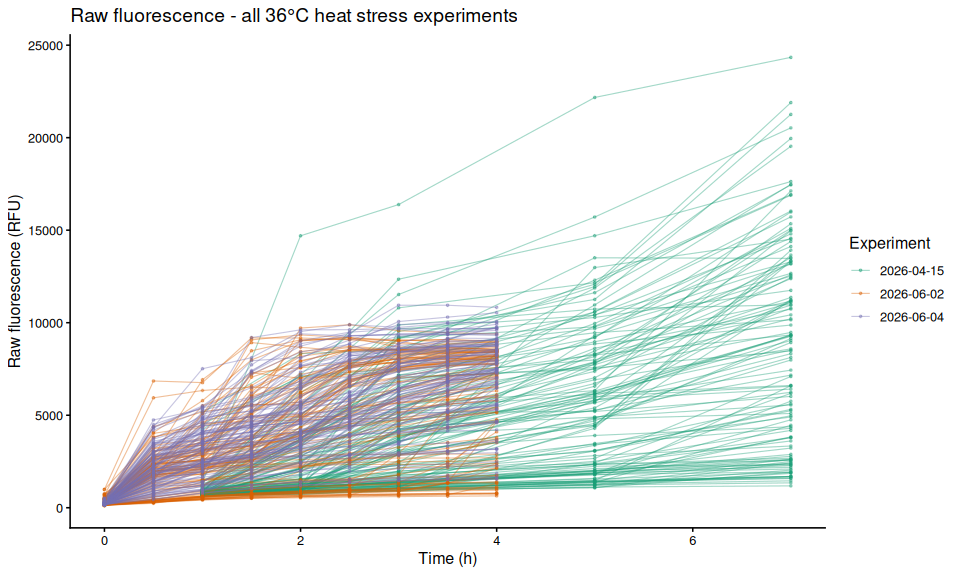
8.4 Save figures
out_dir <- file.path(proj_root, "Resazurin", "outputs",
                     "02.00-resazurin-raw-all-36C-heat-stress-experiments",
                     "figures")

dir.create(out_dir, recursive = TRUE, showWarnings = FALSE)

ggsave(file.path(out_dir, "raw_fluor_all_36C_heat_stress_by_family.png"),
       p_by_family, width = 14, height = 10)

ggsave(file.path(out_dir, "raw_fluor_all_36C_heat_stress_by_experiment.png"),
       p_by_experiment, width = 14, height = 10)

ggsave(
  file.path(out_dir, "raw_fluor_all_36C_heat_stress_single_by_experiment.png"),
  p_all_by_experiment, width = 10, height = 6
)

message("Figures saved to: ", out_dir)