INTRO
This was the initial testing of the Glycogen-Glo Assay (Promega) (GitHub; PDF) using M.gigas (Pacific oyster) ctenidia homegenate from 20251210 (notebook entry).
The idea was to identify a range (i.e. a very rough min/max) of starting tissues amounts that will fall within the range of the Glycogen-Glo standard curves. Additionally, this was an initial walk-through of using this kit to help figure out a general protocol that identified any tips/tricks/pitfalls to aid in developing a Standard Operating Protocol (SOP) for the Roberts Lab Handbook.
The assay will assess both glycogen and glucose content. The way the assay works is to convert any glycogen to glucose. As such, glucose levels also need to be assessed for each sample, in order to subtract that background glucose and get accurate glycogen quantification.
Overall, this process did not go very smoothly, but did highlight several challenges that can be addressed in future runs. Granted, I feel like most of this was related to my personal screw ups, but these will still serve as good guidance on improving this protocol for others.
MATERIALS & METHODS
Sample Selection
Sample A2 was selected due to it’s large tissue amount (50mg). This would allow us to perform serial dilutions representing different starting tissue amounts (roughly).
Assay Preparation
Samples and Standard Curves
Per the manufacturer’s recommendations, all reagents were thawed. After thawing, the Glucoamylase Buffer and Luciferin Detection Solution were kept at room temperature, while the remaining components, including the A2 sample, were kept on ice.
The following dilutions SHOULD have been 1:10 serial dilutions (e.g. 10uL sample in 90uL of dilution buffer)! That is reflected in the equivalent tissue/standard curve concentration values.
HOWEVER, these were, in fact, INCORRECTLY performed as 1:100 dilutions!
The assay was set up to measure the following:
A2 GLYCOGEN content in the following equivalent “tissue” concentrations:
- Not diluted (ND), 25mg, 2.5mg, 0.25mg, 0.025mg, 0mg
- 1:100 dilutions - 1uL sample in 99uL of dilution buffer.
A2 GLUCOSE content in the following equivalent “tissue” concentrations:
- Not diluted (ND), 25mg, 2.5mg, 0.25mg, 0.025mg, 0mg
- 1:100 dilutions - 1uL sample in 99uL of dilution buffer.
GLYCOGEN Standard curve:
- 20ug/uL, 2ug/mL, 0.2ug/uL, 0.02ug/uL, 0ug/uL
- 1:100 dilutions - 1uL sample in 99uL of dilution buffer.
GLUCOSE Standard curve:
- 100µM, 10µM, 1µM, 0.1µM, 0µM
- 1:100 dilutions - 1uL sample in 99uL of dilution buffer.
All dilutions were performed using a 2:1:1 mixture of PBS, 0.3N HCl, and TRIS Buffer (the latter two are supplied with the kit).
The A2 dilutions were performed in duplicate; primarily due to my poor calculations on the amount of the dilution buffer needed. Ugh.
The 25mg tissue equivalents were partially skipped - meaning sample was added to a one or two of the 25mg wells - due to insufficient dilution buffer (bad calculations on my part, as well as potentially low stock volumes available).
For future sample handling, sample homogenate should be thawed, vortexed, and centrifuged prior to pipetting to avoid this issue.
The standard curves were each performed in triplicate.
Assay
Samples and standard curves were prepared according to the manufacturer’s instructions. Theh plate used was a Costar 96-well, white, opaque, flat-bottom.
Briefly, 25uL of sample/standard was added to wells (see the plate layout below). For those samples/standards being assessed for glycogen, 25uL of glucoamylase digestion solution was added. For those samples/standards being assessed for just glucose, 25uL of only Glucoamylase Buffer was added. The plate was loosely covered with aluminum foil to prevent light/debris from getting in the wells, gently shaken by hand for 60s, and incubated at room temp for 1hr. All wells were loaded individually.
After the initial incubation period, 50uL of glucose detection reagent was added to ALL wells using an Eppendorf repeater pipette (Repeater M4). The plate was loosely covered with aluminum foil to prevent light/debris from getting in the wells, gently shaken by hand for 60s, and incubated at room temp for 1hr.
After incubating, luminescence was measured on the Roberts Lab Synergy HTX (Agilent) with the Gen5 software (Agilent).
Plate layout
blank = Blank measurements (buffer only - no sample/standard added)
SPL1 = Glycogen measurements of A2 homogenate.
SPL2 = Glucose measurements of A2 homogenate.
STDGly = Glycogen standard curve measurement.
STDGlu = Glucose standard curve measurement.
| 1 | 2 | 3 | 4 | 5 | 6 | 7 | 8 | 9 | 10 | 11 | 12 | ||
|---|---|---|---|---|---|---|---|---|---|---|---|---|---|
| A | SPL1:1 | SPL1:2 | SPL1:3 | SPL1:4 | SPL1:5 | blank | Well ID | ||||||
| 50 | 25 | 2.5 | 0.25 | 0.025 | Conc/Dil | ||||||||
| B | SPL1:1 | SPL1:2 | SPL1:3 | SPL1:4 | SPL1:5 | blank | Well ID | ||||||
| 50 | 25 | 2.5 | 0.25 | 0.025 | Conc/Dil | ||||||||
| C | SPL2:1 | SPL2:2 | SPL2:3 | SPL2:4 | SPL2:5 | blank | Well ID | ||||||
| 50 | 25 | 2.5 | 0.25 | 0.025 | Conc/Dil | ||||||||
| D | SPL2:1 | SPL2:2 | SPL2:3 | SPL2:4 | SPL2:5 | blank | Well ID | ||||||
| 50 | 25 | 2.5 | 0.25 | 0.025 | Conc/Dil | ||||||||
| E | STDGly1 | STDGly2 | STDGly3 | STDGly4 | STDGly1 | STDGlu1 | STDGlu2 | STDGlu3 | STDGlu4 | STDGlu5 | Well ID | ||
| 20 | 2 | 0.2 | 0.02 | 0 | 100 | 10 | 1 | 0.1 | 0 | Conc/Dil | |||
| F | STDGly1 | STDGly2 | STDGly3 | STDGly4 | STDGly1 | STDGlu1 | STDGlu2 | STDGlu3 | STDGlu4 | STDGlu5 | Well ID | ||
| 20 | 2 | 0.2 | 0.02 | 0 | 100 | 10 | 1 | 0.1 | 0 | Conc/Dil | |||
| G | STDGly1 | STDGly2 | STDGly3 | STDGly4 | STDGly1 | STDGlu1 | STDGlu2 | STDGlu3 | STDGlu4 | STDGlu5 | Well ID | ||
| 20 | 2 | 0.2 | 0.02 | 0 | 100 | 10 | 1 | 0.1 | 0 | Conc/Dil | |||
| H | Well ID | ||||||||||||
| Conc/Dil |
RESULTS
Raw fluorescence
| 1 | 2 | 3 | 4 | 5 | 6 | 7 | 8 | 9 | 10 | 11 | 12 | |
|---|---|---|---|---|---|---|---|---|---|---|---|---|
| A | 185099 | 174562 | 61687 | 7654 | 1762 | 813 | ||||||
| B | 166410 | 181069 | 83790 | 19910 | 10704 | 3187 | ||||||
| C | 843 | 744 | 421 | 237 | 227 | 689 | ||||||
| D | 396 | 230 | 261 | 257 | 221 | 234 | ||||||
| E | 107660 | 9963 | 1968 | 1277 | 1164 | 117932 | 12389 | 1703 | 673 | 606 | ||
| F | 110174 | 10220 | 1875 | 1256 | 737 | 122103 | 12418 | 1748 | 638 | 499 | ||
| G | 102674 | 10001 | 1815 | 1126 | 963 | 121056 | 12415 | 1629 | 480 | 356 | ||
| H |
The following analysis was performed in R and is from Gen5-20260112-mgig-glycogen_glo-dilutions_test.Rmd (GitHub), commit 210087e.
1 BACKGROUND
This was the initial testing of the Glycogen-Glo Assay (Promega) (GitHub; PDF) using M.gigas (Pacific oyster) ctenidia homegenate from 20251210 (notebook entry).
The idea was to identify a range (i.e. a very rough min/max) of starting tissue amounts that will fall within the range of the Glycogen-Glo standard curves. Additionally, this was an initial walk-through of using this kit to help figure out a general protocol that identified any tips/tricks/pitfalls to aid in developing a Standard Operating Protocol (SOP) for the Roberts Lab Handbook.
1.1 Important note(s)
Insoluble material was not pelleted prior to beginning assay, which led to pipetting issues. Dilution factor 2 was skipped in this analysis due to some of these issues.
library(knitr)
library(ggplot2)
library(dplyr)
##
## Attaching package: 'dplyr'
## The following objects are masked from 'package:stats':
##
## filter, lag
## The following objects are masked from 'package:base':
##
## intersect, setdiff, setequal, unionknitr::opts_chunk$set(
echo = TRUE, # Display code chunks
eval = TRUE, # Evaluate code chunks
warning = FALSE, # Hide warnings
message = FALSE, # Hide messages
comment = "", # Prevents appending '##' to beginning of lines in code output
results = 'hold' # Holds output so it's all printed together after code chunk
)2 DATA
Data contains two CSV files: 1. Plate layout: Specifies the contents of each well in the 96-well plate. 2. Raw luminescence readings: Contains the luminescence values measured from the plate.
There are two standard curves on the plate. Both curves have three replicates each: - Glycogen Standard Curve: Rows E, F, G (5, 6, 7), Columns 1-5 - Glucose Standard Curve: Rows E, F, G (5, 6, 7), Columns 8-12
There is a single sample (A2) with six dilution factors for both glycogen and glucose measurements. Dilutions were run in duplicate: - Glycogen Samples: Rows A and B (1, 2), Columns 1-6 - Glucose Samples: Rows C and D (3, 4), Columns 1-6
Sample name layouts are as follows:
<sample>-<analyte>-<tissue amount in mg>-df.<dilution factor>
E.g. A2-glyc-50-df.10
Where: - <sample>: Sample identifier (e.g., A2) - <analyte>: Either “glyc” for glycogen or “gluc” for glucose - <tissue amount in mg>: Amount of tissue originally collected in mg. - <dilution factor>: Dilution factor applied during sample preparation. E.g a dilution factor of 1 means no dilution, 10 means a 1:10 dilution, etc.
plate_layout <- read.csv("https://raw.githubusercontent.com/RobertsLab/sormi-assay-development/refs/heads/main/Glycogen/data/raw_luminescence/layout-Gen5-20260112-mgig-glycogen_glo-dilutions_test.csv", header = FALSE)
raw_luminescence <- read.csv("https://raw.githubusercontent.com/RobertsLab/sormi-assay-development/refs/heads/main/Glycogen/data/raw_luminescence/raw_lum-Gen5-20260112-mgig-glycogen_glo-dilutions_test.csv", header = FALSE)

cat("Plate layout:\n")
str(plate_layout)

cat("\n\n")

cat("Raw luminescence:\n")
str(raw_luminescence)
Plate layout:
'data.frame': 8 obs. of 12 variables:
$ V1 : chr "A2-glyc-50-df.1" "A2-glyc-50-df.1" "A2-gluc-50-df.1" "A2-gluc-50-df.1" ...
$ V2 : chr "A2-glyc-50-df.2" "A2-glyc-50-df.2" "A2-gluc-50-df.2" "A2-gluc-50-df.2" ...
$ V3 : chr "A2-glyc-50-df.20" "A2-glyc-50-df.20" "A2-gluc-50-df.20" "A2-gluc-50-df.20" ...
$ V4 : chr "A2-glyc-50-df.200" "A2-glyc-50-df.200" "A2-gluc-50-df.200" "A2-gluc-50-df.200" ...
$ V5 : chr "A2-glyc-50-df.2000" "A2-glyc-50-df.2000" "A2-gluc-50-df.2000" "A2-gluc-50-df.2000" ...
$ V6 : chr "A2-glyc-50-df.0" "A2-glyc-50-df.0" "A2-gluc-50-df.0" "A2-gluc-50-df.0" ...
$ V7 : logi NA NA NA NA NA NA ...
$ V8 : chr "" "" "" "" ...
$ V9 : chr "" "" "" "" ...
$ V10: chr "" "" "" "" ...
$ V11: chr "" "" "" "" ...
$ V12: chr "" "" "" "" ...
Raw luminescence:
'data.frame': 8 obs. of 12 variables:
$ V1 : int 185099 166410 843 396 107660 110174 102674 NA
$ V2 : int 174562 181069 744 230 9963 10220 10001 NA
$ V3 : int 61687 83790 421 261 1968 1875 1815 NA
$ V4 : int 7654 19910 237 257 1277 1256 1126 NA
$ V5 : int 1762 10704 227 221 1164 737 963 NA
$ V6 : int 813 3187 689 234 NA NA NA NA
$ V7 : logi NA NA NA NA NA NA ...
$ V8 : int NA NA NA NA 117932 122103 121056 NA
$ V9 : int NA NA NA NA 12389 12418 12415 NA
$ V10: int NA NA NA NA 1703 1748 1629 NA
$ V11: int NA NA NA NA 673 638 480 NA
$ V12: int NA NA NA NA 606 499 356 NA3 STANDARD CURVES
3.1 Glycogen Standard Curve
3.1.1 Extract luminescence data
# Extract glycogen standard curve data from plate layout and raw luminescence.
# Rows E, F, G (rows 5, 6, 7) correspond to glycogen standards
# Columns 1-5 contain the standard curve concentrations

# Extract concentration values from plate layout (row 5, columns 1-5)
# Parse concentration from labels like "STD-glyc-20" -> 20
concentrations <- as.numeric(gsub("STD-glyc-", "", plate_layout[5, 1:5]))

# Extract standard curve luminescence values for each replicate from raw_luminescence
row_E <- as.numeric(raw_luminescence[5, 1:5])  # Row 5 (E)
row_F <- as.numeric(raw_luminescence[6, 1:5])  # Row 6 (F)
row_G <- as.numeric(raw_luminescence[7, 1:5])  # Row 7 (G)

# Extract sample data from rows A and B (columns 1, 3, 4, 5, 6)
# Parse dilution factors from labels like "A2-glyc-50-df.10" -> 10
# Skip column 2 (df.2)
sample_cols <- c(1, 3, 4, 5, 6)
dilution_factors_row_A <- as.numeric(gsub(".*-df\\.", "", plate_layout[1, sample_cols]))
dilution_factors_row_B <- as.numeric(gsub(".*-df\\.", "", plate_layout[2, sample_cols]))
sample_luminescence_row_A <- as.numeric(raw_luminescence[1, sample_cols])
sample_luminescence_row_B <- as.numeric(raw_luminescence[2, sample_cols])

# Combine the two rows of samples
dilution_factors <- c(dilution_factors_row_A, dilution_factors_row_B)
sample_luminescence <- c(sample_luminescence_row_A, sample_luminescence_row_B)
3.1.2 Calculate summary statistics and linear regression
# Calculate mean and standard error for each concentration
means <- numeric(length(concentrations))
std_errors <- numeric(length(concentrations))
std_devs <- numeric(length(concentrations))

for (i in 1:length(concentrations)) {
  values <- c(row_E[i], row_F[i], row_G[i])
  means[i] <- mean(values)
  std_devs[i] <- sd(values)
  std_errors[i] <- sd(values) / sqrt(length(values))
}

# Create data frame for plotting
glycogen_summary_data <- data.frame(
  concentration = concentrations,
  mean_luminescence = means,
  se = std_errors,
  sd = std_devs,
  cv = (std_devs / means) * 100
)

# Calculate linear regression and R-squared
lm_model <- lm(mean_luminescence ~ concentration, data = glycogen_summary_data)
r_squared <- summary(lm_model)$r.squared
slope <- coef(lm_model)[2]
intercept <- coef(lm_model)[1]

# Create sample data frame
# Calculate glycogen concentration from luminescence using the standard curve equation
# Rearranging y = mx + b to solve for x: x = (y - b) / m

# Get unique dilution factors
unique_dilution_factors <- unique(dilution_factors_row_A)

# Calculate mean and SE for each dilution factor across replicates
sample_mean_lum <- numeric(length(unique_dilution_factors))
sample_se_lum <- numeric(length(unique_dilution_factors))
sample_mean_glyc_conc <- numeric(length(unique_dilution_factors))

for (i in 1:length(unique_dilution_factors)) {
  df_val <- unique_dilution_factors[i]
  # Get luminescence values for this dilution factor from both rows
  lum_values <- c(sample_luminescence_row_A[dilution_factors_row_A == df_val],
                  sample_luminescence_row_B[dilution_factors_row_B == df_val])
  sample_mean_lum[i] <- mean(lum_values)
  sample_se_lum[i] <- sd(lum_values) / sqrt(length(lum_values))
  # Calculate concentration from mean luminescence
  sample_mean_glyc_conc[i] <- (sample_mean_lum[i] - intercept) / slope
}

sample_data <- data.frame(
  dilution_factor = unique_dilution_factors,
  mean_luminescence = sample_mean_lum,
  se = sample_se_lum,
  glycogen_conc = sample_mean_glyc_conc,
  label = paste0("df.", unique_dilution_factors)
)
3.1.3 Plot Glycogen Standard Curve with Sample Points
# Create the plot
plot <- ggplot(glycogen_summary_data, aes(x = concentration, y = mean_luminescence)) +
  geom_smooth(aes(linetype = "Std Curve Best Fit Line"), method = "lm", se = FALSE,
              color = "coral", linewidth = 1) +
  geom_errorbar(aes(ymin = mean_luminescence - se, ymax = mean_luminescence + se),
                width = 0.1, linewidth = 1, color = "darkblue") +
  geom_point(aes(color = "Standard Curve", shape = "Standard Curve"), size = 4) +
  geom_errorbar(data = sample_data, aes(x = glycogen_conc, y = mean_luminescence,
                ymin = mean_luminescence - se, ymax = mean_luminescence + se,
                color = label), width = 0.1, linewidth = 1) +
  geom_point(data = sample_data, aes(x = glycogen_conc, y = mean_luminescence,
             color = label, shape = label), size = 4) +
  scale_color_manual(name = "",
                     values = c("Standard Curve" = "steelblue",
                                "df.1" = "darkred",
                                "df.2" = "darkorange",
                                "df.20" = "darkgreen",
                                "df.200" = "purple",
                                "df.2000" = "brown",
                                "df.0" = "pink")) +
  scale_shape_manual(name = "",
                     values = c("Standard Curve" = 16,
                                "df.1" = 17,
                                "df.2" = 15,
                                "df.20" = 18,
                                "df.200" = 8,
                                "df.2000" = 4,
                                "df.0" = 3)) +
  scale_linetype_manual(name = "",
                        values = c("Std Curve Best Fit Line" = "dashed")) +
  annotate("label", x = max(glycogen_summary_data$concentration) * 0.75,
           y = max(glycogen_summary_data$mean_luminescence) * 0.15,
           label = sprintf("y = %.2fx + %.2f\nR² = %.4f", slope, intercept, r_squared),
           size = 3.5, fontface = "bold", fill = "white",
           color = "coral", label.padding = unit(0.3, "lines")) +
  labs(
    title = "Glycogen Standard Curve",
    x = "Glycogen Concentration (µg/µL)",
    y = "Luminescence",
    caption = "Error bars represent standard error of the mean (SEM)"
  ) +
  scale_x_continuous(breaks = concentrations) +
  theme_bw() +
  theme(
    plot.title = element_text(size = 14, face = "bold"),
    axis.title = element_text(size = 12, face = "bold"),
    panel.grid.minor = element_line(linetype = "dashed", color = "grey70")
  )

# Save the plot
ggsave("../output/Gen5-20260112-mgig-glycogen_glo-dilutions_test/glycogen_plot.png", plot, width = 10, height = 6, dpi = 300)

# Display the plot
plot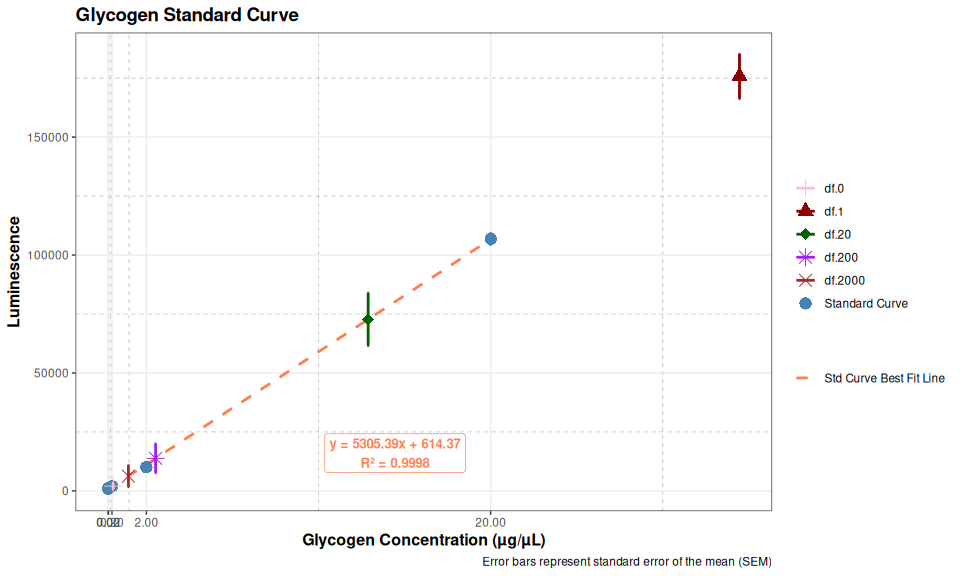
# Print summary statistics
cat("Glycogen Standard Curve Summary:\n")
cat(rep("=", 50), "\n", sep = "")
for (i in 1:nrow(glycogen_summary_data)) {
  cat(sprintf("Concentration: %g µg/µL\n", glycogen_summary_data$concentration[i]))
  cat(sprintf("  Mean Luminescence: %.2f\n", glycogen_summary_data$mean_luminescence[i]))
  cat(sprintf("  Standard Error: %.2f\n", glycogen_summary_data$se[i]))
  cat(sprintf("  CV%%: %.2f%%\n\n", glycogen_summary_data$cv[i]))
}
Glycogen Standard Curve Summary:
==================================================
Concentration: 20 µg/µL
Mean Luminescence: 106836.00
Standard Error: 2203.92
CV%: 3.57%
Concentration: 2 µg/µL
Mean Luminescence: 10061.33
Standard Error: 80.09
CV%: 1.38%
Concentration: 0.2 µg/µL
Mean Luminescence: 1886.00
Standard Error: 44.51
CV%: 4.09%
Concentration: 0.02 µg/µL
Mean Luminescence: 1219.67
Standard Error: 47.22
CV%: 6.71%
Concentration: 0 µg/µL
Mean Luminescence: 954.67
Standard Error: 123.33
CV%: 22.38%3.2 Glucose Standard Curve
3.2.1 Extract luminescence data
# Extract glucose standard curve data from plate layout and raw luminescence.
# Rows E, F, G (rows 5, 6, 7) correspond to glucose standards
# Columns 8-12 contain the standard curve concentrations

# Extract concentration values from plate layout (row 5, columns 8-12)
# Parse concentration from labels like "STD-gluc-100" -> 100
gluc_concentrations <- as.numeric(gsub("STD-gluc-", "", plate_layout[5, 8:12]))

# Extract standard curve luminescence values for each replicate from raw_luminescence
gluc_row_E <- as.numeric(raw_luminescence[5, 8:12])  # Row 5 (E)
gluc_row_F <- as.numeric(raw_luminescence[6, 8:12])  # Row 6 (F)
gluc_row_G <- as.numeric(raw_luminescence[7, 8:12])  # Row 7 (G)

# Extract sample data from rows C and D (rows 3 and 4, columns 1, 3, 4, 5, 6)
# Parse dilution factors from labels like "A2-gluc-50-df.10" -> 10
# Skip column 2 (df.2)
gluc_sample_cols <- c(1, 3, 4, 5, 6)
gluc_dilution_factors_row_C <- as.numeric(gsub(".*-df\\.", "", plate_layout[3, gluc_sample_cols]))
gluc_dilution_factors_row_D <- as.numeric(gsub(".*-df\\.", "", plate_layout[4, gluc_sample_cols]))
gluc_sample_luminescence_row_C <- as.numeric(raw_luminescence[3, gluc_sample_cols])
gluc_sample_luminescence_row_D <- as.numeric(raw_luminescence[4, gluc_sample_cols])

# Combine the two rows of samples
gluc_dilution_factors <- c(gluc_dilution_factors_row_C, gluc_dilution_factors_row_D)
gluc_sample_luminescence <- c(gluc_sample_luminescence_row_C, gluc_sample_luminescence_row_D)
3.2.2 Calculate summary statistics and linear regression
# Calculate mean and standard error for each concentration
gluc_means <- numeric(length(gluc_concentrations))
gluc_std_errors <- numeric(length(gluc_concentrations))
gluc_std_devs <- numeric(length(gluc_concentrations))

for (i in 1:length(gluc_concentrations)) {
  values <- c(gluc_row_E[i], gluc_row_F[i], gluc_row_G[i])
  gluc_means[i] <- mean(values)
  gluc_std_devs[i] <- sd(values)
  gluc_std_errors[i] <- sd(values) / sqrt(length(values))
}

# Create data frame for plotting
glucose_summary_data <- data.frame(
  concentration = gluc_concentrations,
  mean_luminescence = gluc_means,
  se = gluc_std_errors,
  sd = gluc_std_devs,
  cv = (gluc_std_devs / gluc_means) * 100
)

# Calculate linear regression and R-squared
gluc_lm_model <- lm(mean_luminescence ~ concentration, data = glucose_summary_data)
gluc_r_squared <- summary(gluc_lm_model)$r.squared
gluc_slope <- coef(gluc_lm_model)[2]
gluc_intercept <- coef(gluc_lm_model)[1]

# Create sample data frame
# Calculate glucose concentration from luminescence using the standard curve equation
# Rearranging y = mx + b to solve for x: x = (y - b) / m

# Get unique dilution factors
gluc_unique_dilution_factors <- unique(gluc_dilution_factors_row_C)

# Calculate mean and SE for each dilution factor across replicates
gluc_sample_mean_lum <- numeric(length(gluc_unique_dilution_factors))
gluc_sample_se_lum <- numeric(length(gluc_unique_dilution_factors))
gluc_sample_mean_conc <- numeric(length(gluc_unique_dilution_factors))

for (i in 1:length(gluc_unique_dilution_factors)) {
  df_val <- gluc_unique_dilution_factors[i]
  # Get luminescence values for this dilution factor from both rows
  lum_values <- c(gluc_sample_luminescence_row_C[gluc_dilution_factors_row_C == df_val],
                  gluc_sample_luminescence_row_D[gluc_dilution_factors_row_D == df_val])
  gluc_sample_mean_lum[i] <- mean(lum_values)
  gluc_sample_se_lum[i] <- sd(lum_values) / sqrt(length(lum_values))
  # Calculate concentration from mean luminescence
  gluc_sample_mean_conc[i] <- (gluc_sample_mean_lum[i] - gluc_intercept) / gluc_slope
}

gluc_sample_data <- data.frame(
  dilution_factor = gluc_unique_dilution_factors,
  mean_luminescence = gluc_sample_mean_lum,
  se = gluc_sample_se_lum,
  glucose_conc = gluc_sample_mean_conc,
  label = paste0("df.", gluc_unique_dilution_factors)
)
3.2.3 Plot Glucose Standard Curve with Sample Points
# Create the plot
gluc_plot <- ggplot(glucose_summary_data, aes(x = concentration, y = mean_luminescence)) +
  geom_smooth(aes(linetype = "Std Curve Best Fit Line"), method = "lm", se = FALSE,
              color = "coral", linewidth = 1) +
  geom_errorbar(aes(ymin = mean_luminescence - se, ymax = mean_luminescence + se),
                width = 0.1, linewidth = 1, color = "darkblue") +
  geom_point(aes(color = "Standard Curve", shape = "Standard Curve"), size = 4) +
  geom_errorbar(data = gluc_sample_data, aes(x = glucose_conc, y = mean_luminescence,
                ymin = mean_luminescence - se, ymax = mean_luminescence + se,
                color = label), width = 0.1, linewidth = 1) +
  geom_point(data = gluc_sample_data, aes(x = glucose_conc, y = mean_luminescence,
             color = label, shape = label), size = 4) +
  scale_color_manual(name = "",
                     values = c("Standard Curve" = "steelblue",
                                "df.1" = "darkred",
                                "df.20" = "darkgreen",
                                "df.200" = "purple",
                                "df.2000" = "brown",
                                "df.0" = "pink")) +
  scale_shape_manual(name = "",
                     values = c("Standard Curve" = 16,
                                "df.1" = 17,
                                "df.20" = 18,
                                "df.200" = 8,
                                "df.2000" = 4,
                                "df.0" = 3)) +
  scale_linetype_manual(name = "",
                        values = c("Std Curve Best Fit Line" = "dashed")) +
  annotate("label", x = max(glucose_summary_data$concentration) * 0.75,
           y = max(glucose_summary_data$mean_luminescence) * 0.15,
           label = sprintf("y = %.2fx + %.2f\nR² = %.4f", gluc_slope, gluc_intercept, gluc_r_squared),
           size = 3.5, fontface = "bold", fill = "white",
           color = "coral", label.padding = unit(0.3, "lines")) +
  labs(
    title = "Glucose Standard Curve",
    x = "Glucose Concentration (µg/µL)",
    y = "Luminescence",
    caption = "Error bars represent standard error of the mean (SEM)"
  ) +
  scale_x_continuous(breaks = gluc_concentrations) +
  theme_bw() +
  theme(
    plot.title = element_text(size = 14, face = "bold"),
    axis.title = element_text(size = 12, face = "bold"),
    panel.grid.minor = element_line(linetype = "dashed", color = "grey70")
  )

# Save the plot
ggsave("../output/Gen5-20260112-mgig-glycogen_glo-dilutions_test/glucose_plot.png", gluc_plot, width = 10, height = 6, dpi = 300)

# Display the plot
gluc_plot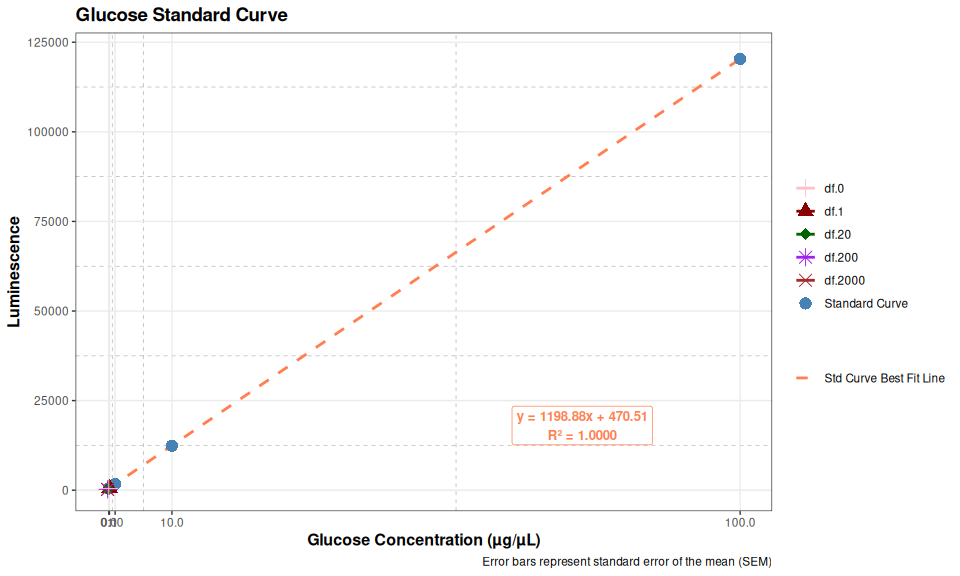
# Print summary statistics
cat("Glucose Standard Curve Summary:\n")
cat(rep("=", 50), "\n", sep = "")
for (i in 1:nrow(glucose_summary_data)) {
  cat(sprintf("Concentration: %g µg/µL\n", glucose_summary_data$concentration[i]))
  cat(sprintf("  Mean Luminescence: %.2f\n", glucose_summary_data$mean_luminescence[i]))
  cat(sprintf("  Standard Error: %.2f\n", glucose_summary_data$se[i]))
  cat(sprintf("  CV%%: %.2f%%\n\n", glucose_summary_data$cv[i]))
}
Glucose Standard Curve Summary:
==================================================
Concentration: 100 µg/µL
Mean Luminescence: 120363.67
Standard Error: 1252.84
CV%: 1.80%
Concentration: 10 µg/µL
Mean Luminescence: 12407.33
Standard Error: 9.21
CV%: 0.13%
Concentration: 1 µg/µL
Mean Luminescence: 1693.33
Standard Error: 34.69
CV%: 3.55%
Concentration: 0.1 µg/µL
Mean Luminescence: 597.00
Standard Error: 59.37
CV%: 17.22%
Concentration: 0 µg/µL
Mean Luminescence: 487.00
Standard Error: 72.42
CV%: 25.76%4 SAMPLE A2 QUANTIFICATION
The results here (Total glycogen) reflect the poor pipetting - the numbers aren’t particularly close. In fact, the 2000 dilution factor is an order of magnitude higher than the others.
# Function to calculate concentration from luminescence using linear model
# Returns concentration or "OUT OF RANGE" message
calculate_concentration <- function(luminescence, slope, intercept, min_conc, max_conc, units) {
  # Calculate concentration from y = mx + b -> x = (y - b) / m
  concentration <- (luminescence - intercept) / slope

  # Check if within range
  if (concentration < min_conc) {
    return("OUT OF RANGE - TOO LOW")
  } else if (concentration > max_conc) {
    return("OUT OF RANGE - TOO HIGH")
  } else {
    return(sprintf("%.4f %s", concentration, units))
  }
}

# Glycogen calculations
cat("GLYCOGEN ASSAY RESULTS (Sample A2):\n")
cat(rep("=", 100), "\n", sep = "")
cat(sprintf("%-15s %-20s %-25s %s\n", "Dilution Factor", "Luminescence", "Calculated Glycogen", "Total Glycogen"))
cat(rep("-", 100), "\n", sep = "")

glycogen_min <- min(concentrations)
glycogen_max <- max(concentrations)

# Sort by dilution factor
sample_data_sorted <- sample_data[order(sample_data$dilution_factor), ]

for (i in 1:nrow(sample_data_sorted)) {
  result <- calculate_concentration(
    sample_data_sorted$mean_luminescence[i],
    slope,
    intercept,
    glycogen_min,
    glycogen_max,
    "µg/µL"
  )

  # Calculate total glycogen (concentration in original sample before dilution)
  conc <- (sample_data_sorted$mean_luminescence[i] - intercept) / slope
  df <- sample_data_sorted$dilution_factor[i]
  # Handle division by zero for df=0
  if (df == 0) {
    total_result <- "N/A"
  } else {
    total_glyc <- conc * df
    # Check if within range after accounting for dilution
    if (total_glyc < glycogen_min * df) {
      total_result <- "OUT OF RANGE - TOO LOW"
    } else if (total_glyc > glycogen_max * df) {
      total_result <- "OUT OF RANGE - TOO HIGH"
    } else {
      total_result <- sprintf("%.4f µg/µL", total_glyc)
    }
  }

  cat(sprintf("%-15s %-20.0f %-25s %s\n",
              sample_data_sorted$label[i],
              sample_data_sorted$mean_luminescence[i],
              result,
              total_result))
}

cat("\n\n")

# Glucose calculations
cat("GLUCOSE ASSAY RESULTS (Sample A2):\n")
cat(rep("=", 100), "\n", sep = "")
cat(sprintf("%-15s %-20s %-25s %s\n", "Dilution Factor", "Luminescence", "Calculated Glucose", "Total Glucose"))
cat(rep("-", 100), "\n", sep = "")

glucose_min <- min(gluc_concentrations)
glucose_max <- max(gluc_concentrations)

# Sort by dilution factor
gluc_sample_data_sorted <- gluc_sample_data[order(gluc_sample_data$dilution_factor), ]

for (i in 1:nrow(gluc_sample_data_sorted)) {
  result <- calculate_concentration(
    gluc_sample_data_sorted$mean_luminescence[i],
    gluc_slope,
    gluc_intercept,
    glucose_min,
    glucose_max,
    "µM"
  )

  # Calculate total glucose (concentration in original sample before dilution)
  conc <- (gluc_sample_data_sorted$mean_luminescence[i] - gluc_intercept) / gluc_slope
  df <- gluc_sample_data_sorted$dilution_factor[i]
  # Handle division by zero for df=0
  if (df == 0) {
    total_result <- "N/A"
  } else {
    total_gluc <- conc * df
    # Check if within range after accounting for dilution
    if (total_gluc < glucose_min * df) {
      total_result <- "OUT OF RANGE - TOO LOW"
    } else if (total_gluc > glucose_max * df) {
      total_result <- "OUT OF RANGE - TOO HIGH"
    } else {
      total_result <- sprintf("%.4f µM", total_gluc)
    }
  }

  cat(sprintf("%-15s %-20.0f %-25s %s\n",
              gluc_sample_data_sorted$label[i],
              gluc_sample_data_sorted$mean_luminescence[i],
              result,
              total_result))
}
GLYCOGEN ASSAY RESULTS (Sample A2):
====================================================================================================
Dilution Factor Luminescence Calculated Glycogen Total Glycogen
----------------------------------------------------------------------------------------------------
df.0 2000 0.2612 µg/µL N/A
df.1 175754 OUT OF RANGE - TOO HIGH OUT OF RANGE - TOO HIGH
df.20 72738 13.5945 µg/µL 271.8899 µg/µL
df.200 13782 2.4819 µg/µL 496.3867 µg/µL
df.2000 6233 1.0590 µg/µL 2118.0833 µg/µL
GLUCOSE ASSAY RESULTS (Sample A2):
====================================================================================================
Dilution Factor Luminescence Calculated Glucose Total Glucose
----------------------------------------------------------------------------------------------------
df.0 462 OUT OF RANGE - TOO LOW N/A
df.1 620 0.1243 µM 0.1243 µM
df.20 341 OUT OF RANGE - TOO LOW OUT OF RANGE - TOO LOW
df.200 247 OUT OF RANGE - TOO LOW OUT OF RANGE - TOO LOW
df.2000 224 OUT OF RANGE - TOO LOW OUT OF RANGE - TOO LOWDISCUSSION
SUMMARY
Things we’ve learned:
Pellet insoluble material before pipetting.
Glucose does not really appear to be present (detectable) in ctenidia tissue. This suggests that we can skip running this aspect of the assay going forward. However, some additional testing would be beneficial.
Samples will need to be diluted to fall withing the standard curve.